
A fairly quick update on COVID numbers.
The good news is that the growth in daily cases has slowed. The 7 day average is at 215,729, which is about 5,000 more than it was a week ago. That’s only a tenth of the increase it saw in the previous week. The situation with deaths is less clear. While the week over week gains slowed a bit, there has been some acceleration over the last few days. It’s too early to know whether it will continue. Here’s the chart, and then I’ll say a bit about some background issues.
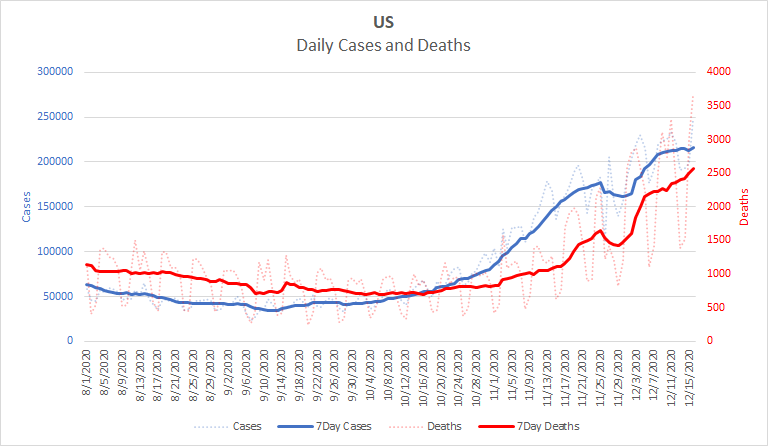
The numbers are still very high, but the curves are less steep than they might be. However, all this takes place against a noisier data background, presumably because of the holidays. Let’s take a quick look at testing. This graph is from 1point3acres.com and shows testing over the same period as the graph above.
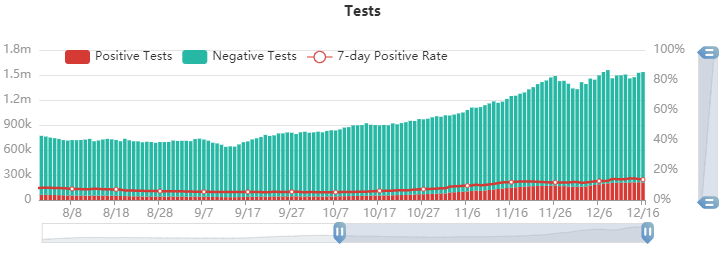
There are a couple of things to note here. First, since Thanksgiving, the number of tests has leveled off, with more variability from day to day. (Look at how the height of the bars vary.) There’s a good correlation between number of tests and number of cases. In general, the more people you test, the more cases you will identify. If 5% of the population has COVID, you expect at least 5% of tests to come back positive – more tests = more identified cases. Second, since Thanksgiving, the percent of positive tests has increased from 12% to 14%. What does this mean?
There are two reasons we might see an increase in the percentage of positive tests. First, it might be that the rate of COVID infection in the community has increased. If a greater percentage of the population has COVID, you expect a greater percentage of tests to come back positive. Second, people have become less inclined to get tested, so only people with higher risks are getting tested. If only very high risk people get tested, you expect to see a higher rate of positives.
How does all this come together? Well, we know that people’s behavior changes during the holidays. It wouldn’t be surprising if people were generally less inclined to get tested during the holiday season. This would mean that the people who do get tested would generally be higher risk and so the percent of positive tests would rise. The pool of tests is focused on a narrower, higher risk band than it was before Thanksgiving. At the same time we’re seeing about the same number of tests overall. So the number of people in the narrower high risk band now is about the same as the number of people in the broader not-as-high risk band before Thanksgiving. So, overall, the risk in the population has gone up. If we were testing the same risk profile as we were before Thanksgiving, we would need to test more people.
The very short version is that changes in testing indicate higher COVID risk in general but also a lower tendency for people to get tested. Exactly how much each of those factors influence the case numbers is hard to know, but there’s undoubtedly some influence from each. This in turn means that we’re probably finding a lower percentage of all the actual cases than we were before Thanksgiving. So real cases are probably growing somewhat faster than reported cases, we just don’t know how much faster.
One way to get around this problem is to look at hospitalizations, as in this graph from 1point3acres.com .
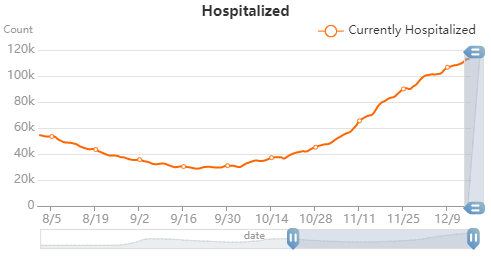
As you can see, hospitalizations don’t show the same flattening that we see in cases. Again, there are several reasons this might be, including the lag between identifying a case, admitting the person to the hospital, and discharging them from the hospital. Still, this adds credence to the idea that at least some of the flattening we’ve seen is not real.
Unfortunately, we won’t really be able to tease all of these factors apart until after the holidays. I expect that in general, case number will be a bit suppressed until January. At that point, I wouldn’t be surprised to see an explosion due both to more people getting tested and a lot of holiday exposure. In the meantime, deaths and hospitalizations are probably a better measure of how things are really going than are case reports.
Be as safe as you can over the holidays. If you decide to take risks, minimize them as much as you can. Wear masks, pay attention to airflow and filtration, avoid prolonged exposure in confined spaces. It’s like sex. Safe sex has become a common concept. If you aren’t 100% sure your partner isn’t infected, either don’t have sex, or use precautions. Treat holiday contacts the same way. If you aren’t 100% sure someone isn’t infected, take precautions as if they were. No one wants to get COVID for Christmas.