
I haven’t done a numbers update in a couple of week as the numbers have been pretty wonky from the Holiday season. Let’s start with a look back at 2020.
We ended the year with cumulative totals of 19,968,087 cases and 345,737 deaths. So in the 10 months we’ve been tracking COVID, roughly one out of every 17 people has been infected and more than one out of every 1,000 has died. Globally, the cumulative infection rate is about one out of every 92 people and the cumulative death rate is one out of every 4,300, so the US has fared considerably worse than the global average
Here’s the daily graph for the US since March.
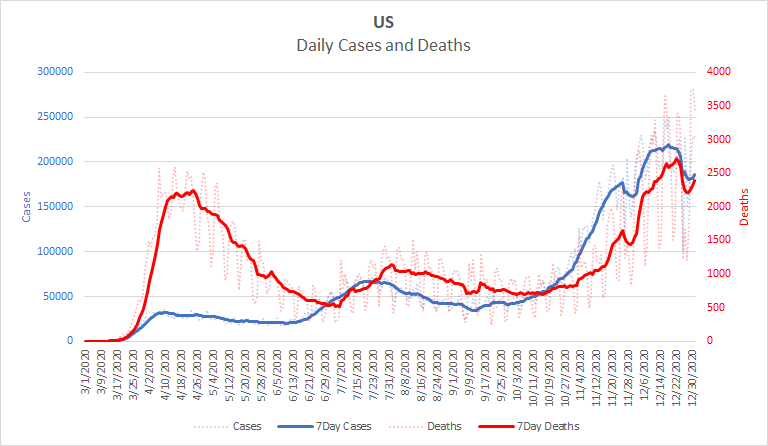
The blue line shows daily cases for the year and is read from the left hand axis. December was easily the worst month and more than half of the total cases occurred in the final two months of the year. The red line shows daily reported deaths and is read off the right hand axis. Although April and May were horrific in terms of mortality rate – the percentage of cases that ended in death – November and December were worse in terms of total deaths. Roughly one third of all COVID deaths have been in the last two months.
Where does this put us going into 2021? The short answer is that we’re still very much in the grip of the third wave, but it’s difficult to say which direction we’re headed. Let’s zoom in a bit to see why. Here is the graph zoomed in to just since September.
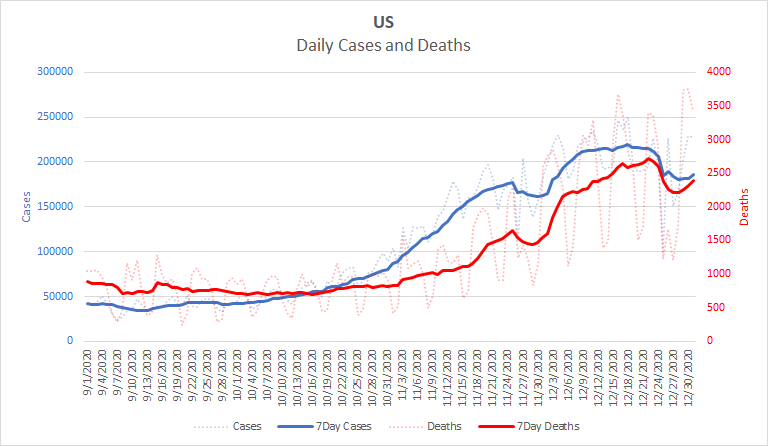
As a reminder, the dotted lines are the actual daily reported numbers. They go up and down on a weekly cycle – high in the middle of the week, low on the weekend. The thick lines are the average number of cases over the previous week. The 7 day average gives a clearer picture because it smooths out the weekly cycle. If you look at the thick red line, you can see three prominent dips: Labor Day, Thanksgiving, and Christmas. The virus, of course, doesn’t care about holidays or weekends. The dips at holidays and the weekly cycle are because people care about these things. People who handle reporting tend not to work on the weekend or holidays. People’s willingness to be tested or to go to a hospital can also be affected by weekends and holidays. The bigger the holiday, the bigger the disturbance it creates in reporting. It’s easy to see that Thanksgiving had a much bigger dip than Labor Day. Christmas, of course, is the biggest holiday of all. It’s not just a holiday, it’s a whole season that starts with Thanksgiving and ends with New Year’s Day. Further, Thanksgiving, Christmas, and New Year’s Day are each followed closely by a weekend, making 4 days of disturbance for each rather than just one. There are a lot of reasons to think that reported numbers would be depressed during this time.
On the graph, we can see the numbers dive sharply right about Christmas and then start to rise again on the following Monday. What we don’t know is how much they will rise. The period between Thanksgiving and Christmas looks like cases might have plateaued. You can even see the plateau starting a bit before Thanksgiving. If that plateau is real, then we might see lower case numbers in January. However, that plateau may just be an effect of the holiday season itself – fewer people being tested, fewer people wanting to have their symptoms checked out, etc. Notice that we don’t see a similar plateau in deaths. Reported deaths are affected by the reporters taking time off, so there are dips on weekends and holidays, but would be less likely to be affected by the holiday season more broadly. The fact that deaths don’t follow the pattern of cases, even a month later, is some reason to think that the case plateau doesn’t reflect actual infection rates.
Similarly, we haven’t seen any plateau in hospitalizations, which should lag reported cases even less than deaths do. Here is the hospitalization graph from 1point3acres.com .
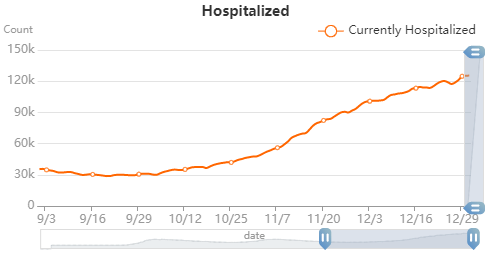
People don’t exercise as much choice about hospitalizations as they do about testing, so the fact that hospitalizations have continued to increase is some reason to think that actual cases have also. Testing rates have been relatively flat, though volatile, since Thanksgiving but the percent of tests that come back positive has increased by a couple of percentage points. It’s hard to say why testing has plateaued, but the fact that the positive rate remains high and is increasing is not a good sign.
So, the reported numbers show a plateau, and maybe a slight decrease in daily case numbers. If those are right, we should see the numbers rise over the next week as the Christmas dip fades, but then start to drop again. But if the plateau is more about the holidays than about infections, then we should see those numbers rise above where they were before Christmas. Keep an eye on the 7 day average over the next week. If the average cases rise above 210,000, or deaths rise above 2600, that’s a bad sign.
There are two more unknowns that will affect the coming weeks. The first is the effect of holiday travel. We know that a lot of people had gatherings for the holidays and a lot of people didn’t. We don’t yet know how that will play out in infection rates. The second is that we have found multiple cases of a new, more infectious, variant of the virus. This variant was originally identified in the UK where it is quickly becoming the predominant strain. This variant has been found in California, Colorado, and Florida. With that spread and a greater infectiousness, it’s a fair bet that the variant is firmly established across the US. We know that the variant spreads more easily than others, but don’t yet know whether it is more dangerous to those that catch it. There’s no evidence that it results in worse outcomes, but research is ongoing and we don’t yet have a final answer. The good news is that most experts think that current vaccines will be effective against it. I expect we’ll learn a lot about this variant over the next few weeks as researchers have a chance to focus on it.
So, I don’t yet have a good sense of what January is going to bring. It may drop to November levels, or it may rise above December, it’s too soon to tell. With the holiday season past and the New Year in front of us, now is a good time to reevaluate our safety precautions. We’ve all made it this far, vaccines are being rolled out, it’s time to renew our efforts, not relax them. It may help to put this pandemic in perspective. Only two events in our country’s history have killed as large a percentage of the population as quickly, the 1918 flu and the Civil War. Both of those were before modern medicine could help to stem the losses. COVID is no small thing (irony intended), but we’re on the verge of beating it, we just need to keep pressing on.