
I’ve recently taken on some extra contract work and so don’t have as much time to devote to these updates. I’m going to aim for a couple per week, though I’ll try to add an extra if there are specific issues.
Nationally, case numbers continue at a high plateau with perhaps some slight decrease. Daily deaths are increasing and accelerating. The 7 day average for deaths is over 1100 now, up from about 600 per day in early July. Here’s the national graph.

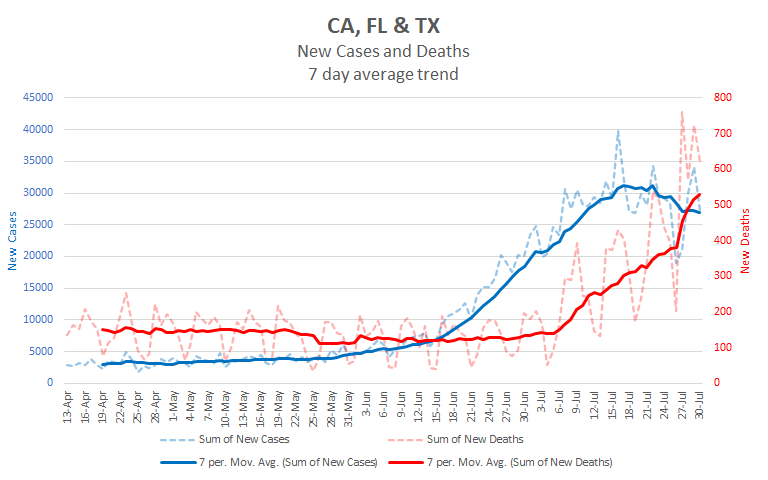
The state levels are a bit of mixed bag. Texas and Florida seem to have declining case numbers, but California is still rising slowly. However, daily deaths are rising in all three states. Here is their combined graph.
At the next tier down, states averaging more than 1,000 cases per day, there’s even more of a mix. Some states are rising, others are steady, and some are falling. When you put them in a group, the result is slowly rising case numbers. There are 13 states in this group noHere is the graph for the group.

The highest daily case numbers are still concentrated in the sun belt, though there are states from other areas. For example, Virginia, Ohio, and Illinois all have more than 1,000 cases per day on average. Pennsylvania and Maryland each have more than 900 cases per day and are rising steadily, so they will probably be in the 1,000+ group soon.
So, overall, I expect cases to be more or less stable at high levels for a while longer while daily deaths continue to rise. Deaths started rising nationally about 3 weeks after cases did. If that relationship holds, we have another couple of weeks of rising deaths ahead of us. Here is what that might look like.
| Day | Cases | Deaths |
| 7/30 | 4,494,449 | 152,052 |
| 7/31 | 4,558,949 | 153,350 |
| 8/1 | 4,623,449 | 154,649 |
| 8/2 | 4,687,949 | 155,947 |
| 8/3 | 4,752,449 | 157,246 |
| 8/4 | 4,816,949 | 158,545 |
| 8/5 | 4,881,449 | 159,843 |
| 8/6 | 4,945,949 | 161,142 |
| 8/7 | 5,010,449 | 162,440 |
| 8/8 | 5,074,949 | 163,739 |
| 8/9 | 5,139,449 | 165,037 |