
The high level overview is that daily cases continue to decrease while daily deaths continue to increase. It appears that daily cases may be decreasing more rapidly than I would have anticipated, but it will take a few more days before that settles out. The real question about cases is how far they will drop. In April and May we dropped about 33%, from 30,000 per day to 20,000 per day. A similar drop this time would bring us down to about 45,000 per day. If we can’t do better than that, then we should expect an even more severe outbreak around early October. I’m not doing anything fancy in making that prediction, just applying the same time frame as the previous cycle. Humans tend to be pretty predictable; something bad happens and we go into crisis mode, but as soon as the crisis mode passes, we go back to what we were doing before. Throw in the end of summer, increasing time spent indoors, and the politicization of preventative measures and October could make July look like, … well, like July made April look. Here’s what the long view on the national numbers looked like as of this Tuesday morning.
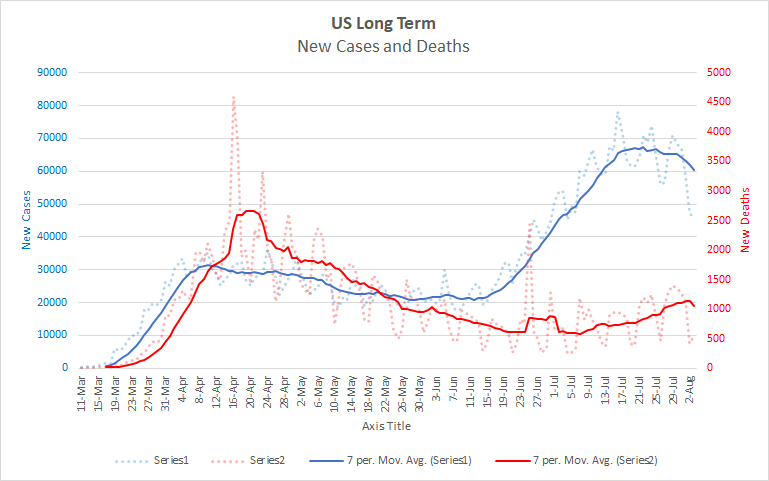
One thing to note in this graph is that the weekly cycle is becoming more pronounced – the difference between highs and low in each cycle is greater than it was. This can make the averages a bit more volatile than they otherwise might be. For example, you can see that the red line representing average deaths hooks down a bit at the very end. That probably doesn’t mean anything. We’ve already seen more deaths this Tuesday than we did a week ago, so the line will go up a bit again tomorrow. Deaths started to rise about three weeks after cases did, so I would expect them to continue to rise through this next week at least.
By my count 16 states have rising cases, and 21 have rising deaths. However, these are largely different states. Only half a dozen states are clearly rising in both cases and deaths. So it’s still largely a matter of whether the states who have already crested in cases will continue to fall faster than the other states rise. They probably will for a while, it’s easier to decrease a given number of cases from a high point than it is to add the same number of cases from a lower point. A similar dance will play out with deaths. So long as our response to the virus remains largely regional, we should see these general patterns continue. To really make headway we need a prolonged national response, something we haven’t been able to muster yet.
My last projection was a bit high, so I’ve toned it down a bit this time. We should hit 5 million cases in about a week or a bit less. You may start hearing about it as soon as Saturday depending on which tracker you news source is following. Here’s a projection for the next 10 days.
| Day | Cases | Deaths |
| 8/3 | 4,713,388 | 155,399 |
| 8/4 | 4,759,791 | 156,717 |
| 8/5 | 4,806,194 | 157,541 |
| 8/6 | 4,852,597 | 158,366 |
| 8/7 | 4,899,000 | 159,190 |
| 8/8 | 4,945,403 | 160,015 |
| 8/9 | 4,991,806 | 160,839 |
| 8/10 | 5,038,209 | 161,664 |
| 8/11 | 5,084,612 | 162,488 |
| 8/12 | 5,131,015 | 163,313 |
| 8/13 | 5,177,418 | 164,137 |
Be well!