
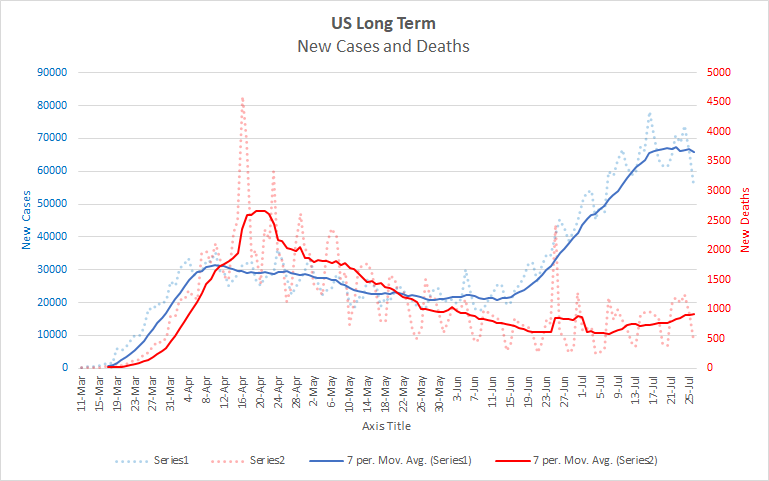
There’s not a lot new to say about the numbers this morning. The national case numbers have stopped growing, but it’s not yet clear whether they will begin to fall and if so, how quickly they might do so. National deaths continue to rise slowly but they are accelerating. The picture is obscured by the fact that yesterday’s (Sunday’s) case numbers were quite low despite the previous several days’ having been high. This sort of fluctuation isn’t unusual, but it makes it harder to see what’s going on in the short term. My best guess is that we’ll be seeing a slow decline in case numbers over the next few weeks along with a continued rise in daily deaths. I expect it to take quite a bit longer to get back to the numbers we were seeing in early June, at least a couple of months, likely more. Here is the longer term national graph so that you can draw your own conclusions. I’m using the longer view for this graph as it more clearly shows how fare we have to go to get back to early June levels.
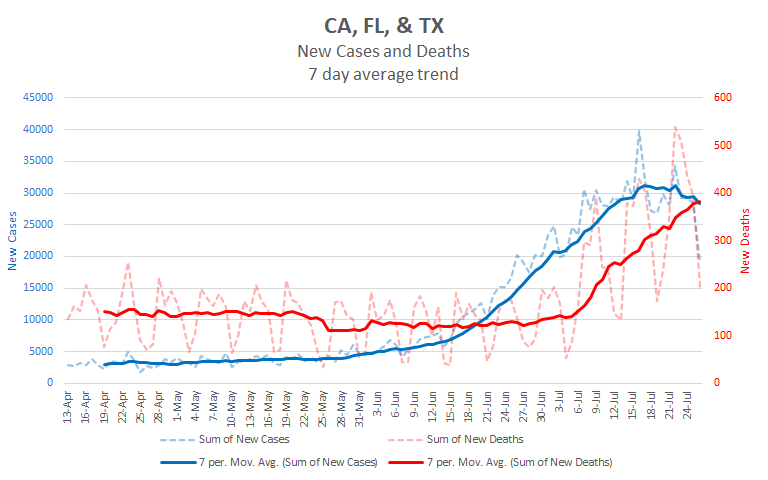
California’s case numbers are continuing to rise slowly, with death counts following the same pattern. Florida and Texas have seen their case numbers begin to decline over the last week, though their daily deaths are still rising. These three states continue to account for a bit more than 40% of datioy national cases and deaths.
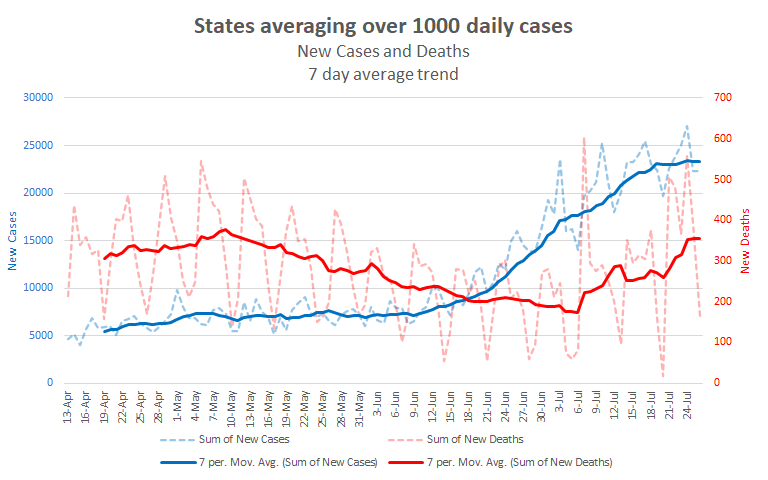
Thirteen other states are averaging over 1000 cases per day. Together they account for just under 40% of daily cases and about 35% of daily deaths. Here is their combined graph.
So, overall, I expect national case numbers to remain high though perhaps decreasing a bit. National daily deaths are likely to continue to increase and may accelerate somewhat.
However, all of this is against the backdrop of only having reported numbers. There have been reports of delays in getting test results and some concerns about whether particular states might be intentionally underreporting numbers. I haven’t seen anything that definitively shows that these issues have impacted reporting, but it’s worth remembering that the numbers here reflect only what is reported and so do not give a complete picture. We don’t know by exactly how much, but research indicates that total COVID19 infections may be 10 times the reported numbers and deaths may be 30% higher than reported. It’s definitely worth following the reported numbers to get a sense of how things are changing in close to real time, but we shouldn’t think they tell the full story.
With all of that, here’s what the next 10 days may bring. I’ve tried to account for decreasing case numbers, but since the pattern is not yet clear, these numbers are likely to be off a bit more than usual.
| Day | Cases | Deaths |
| 7/26 | 4,233,771 | 146,932 |
| 7/27 | 4,292,656 | 147,755 |
| 7/28 | 4,358,548 | 148,577 |
| 7/29 | 4,422,906 | 149,399 |
| 7/30 | 4,485,838 | 150,221 |
| 7/31 | 4,547,602 | 151,043 |
| 8/1 | 4,608,422 | 151,865 |
| 8/2 | 4,668,458 | 152,688 |
| 8/3 | 4,727,816 | 153,510 |
| 8/4 | 4,786,571 | 154,332 |
| 8/5 | 4,844,777 | 155,154 |
Thanks for reading.