
National Numbers
Yesterday, June 18, saw 27,762 new cases added nationally. To put this in perspective, let’s look at the national graph for new cases.
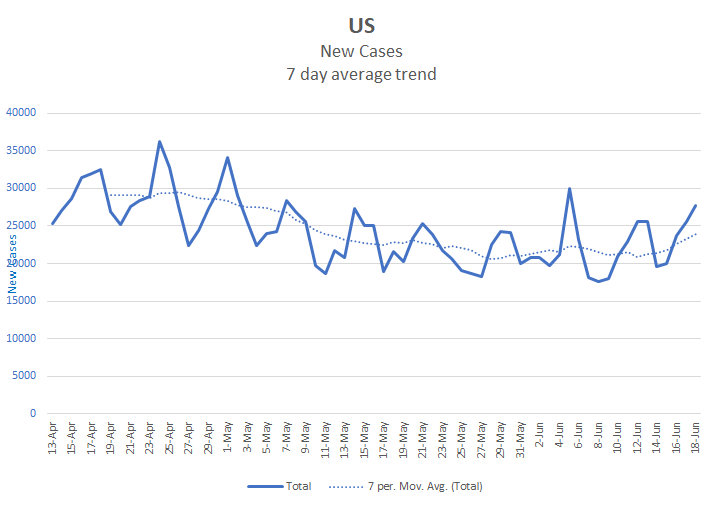
About two weeks ago there was a higher spike of 29,972 cases. However, that spike was driven by a single state, Michigan, recording a backlog of over 5,000 probable cases. In reality, there were only about 24,000 cases that were new on that day. To find a day with more new cases than yesterday, we need to look all the way back to the 7th of May.
Of course, daily counts can have a lot of noise in them. Yesterday was only a little bit higher that the 14th of May, for example, and that difference may not really mean anything. So let’s consider the 7 day running average. As of yesterday, that average was at 23,958. The previous time it was that high was May 10.
So, whichever way you look at it, our daily cases numbers are back to where they were over a month ago. It may seem sudden that we’ve erased a month of gains in just about a week of rising cases. There are two factors contributing to this. First, for two weeks in late May and early June we were just holding steady. Second, for two weeks prior to that we were decreasing very slowly. So the month of gains that we have erased were really two weeks of minimal gains.
In thinking about this, it’s important to remember that the virus wants to grow exponentially, to snowball. We have to take positive action to keep it from doing this. It’s fairly easy to reduce it’s growth a little, harder to reduce it a lot, and extremely hard to stop it completely. Any time we ease up on our efforts to contain infection rates, the virus will take advantage of that and try to rise. The best we can hope for is that we can ease up just enough to keep infections at a steady rate, but that is a difficult balance to achieve.
I’ve recently focused on percentage growth rates. Let’s have a look at those. Here is the national graph.
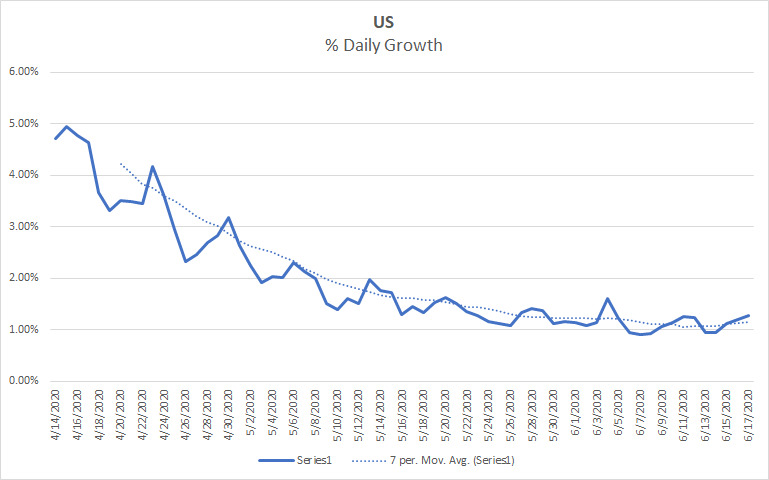
This graph makes the recent rise less noticeable. As an aside, this is why it’s important to take a few moments to really understand what a graph means, looks can be deceiving. Yesterday’s percentage growth was 1.28%. Ignoring the spike on June 5th, the previous time we had at least this much growth in a day was on May 30. This is more recent than the similar comparison based on daily numbers because of the measure we’re looking at. As cumulative numbers rise, it takes greater changes to make the same percentage difference.
Where is the rise coming from? Largely the same group of states we’ve already been looking at. States in the upper midwest and the northeast of the nation are mostly holding steady or decreasing, but the rate of decrease slows as numbers get lower and lower. Meanwhile, states in the south and west are increasing and doing so ever more rapidly. Here is the graph for daily cases in the group of rising states. Notice that the last three days have each seen a record number of new cases for the group.
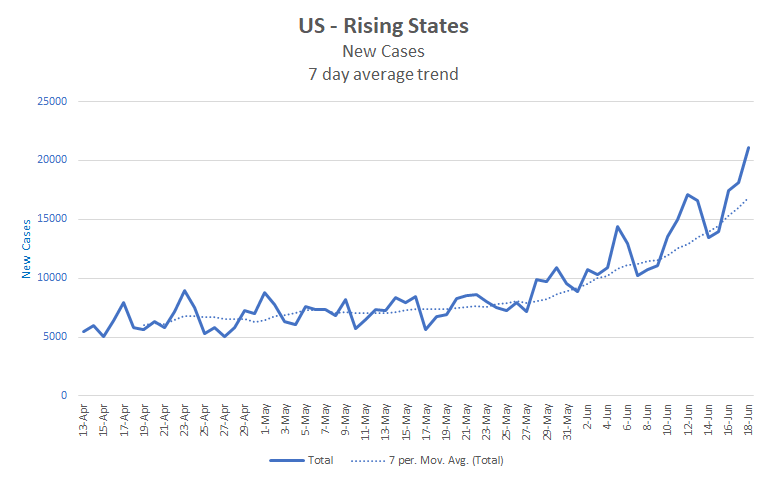
To put the numbers in perspective, yesterday this group added 21,107 cases. That is about the same number as the entire nation was adding each day a week ago. The graph shows the upward curve that indicates exponential rather than linear growth. As this growth continues, this group’s numbers will increasingly drive the national numbers. At its current growth rate, it will double, that’s an additional 700,000 cases, in the next 25 days. However, given the shape of the chart and the lag between imposing restrictions and seeing their effects, I expect the growth rate to continue to increase significantly, thus shortening the doubling period.
States
Now let’s look at some states. I’m going to start with Oklahoma as it has been getting a lot of press due to the Trump campaign rally that is scheduled for tomorrow. Here is the COVID environment in which that rally will take place.
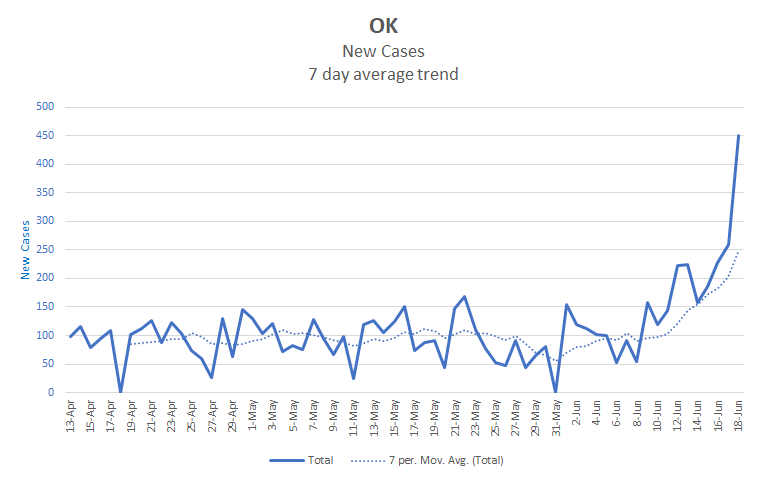
Just for the record, I can see no indication that Oklahoma has recently increased its testing levels. Testing data isn’t particularly robust, but what data I see has the state testing at about the same rate it has been for several weeks.
Next, here are the three most populous states, California, Texas, and Florida, all of which are in the rising group.
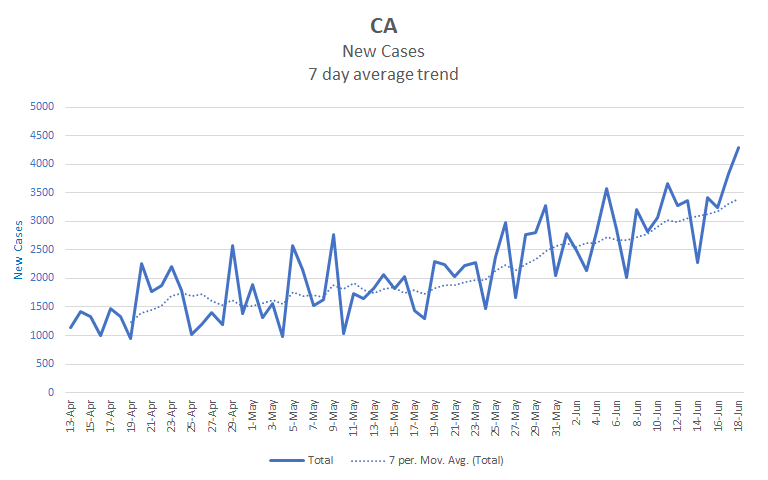
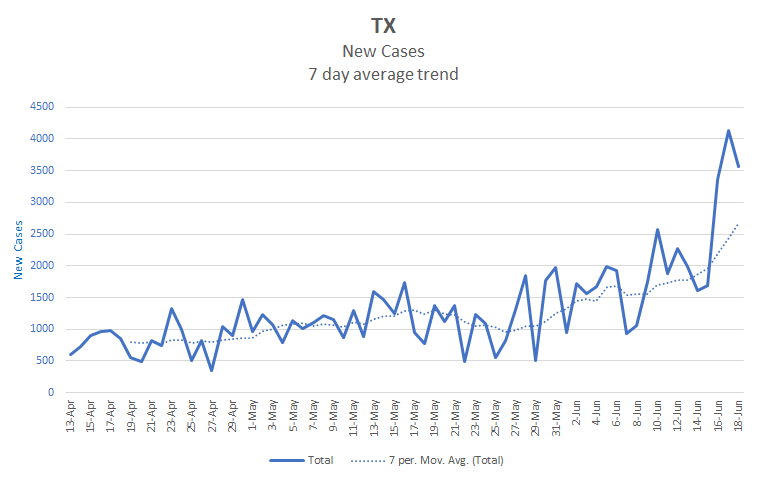
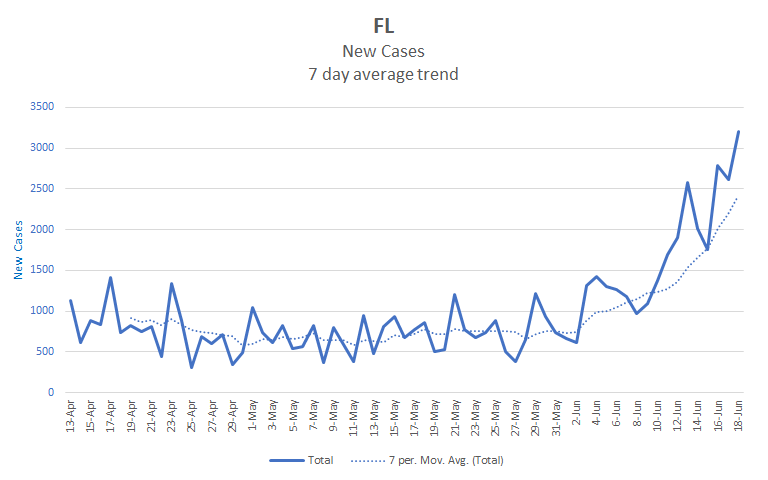
California is adding the most cases per day of the three, but it is growing linearly while Texas and Florida are growing exponentially. As a result, we should soon see Texas and Florida both overtake California’s daily numbers. Combined, these three states have accounted for about 40% of the national numbers over the last few days. As the most populous states, they still have a lot of room for growth.
Arizona is another state to watch. It’s raw numbers aren’t as high as California, Texas, and Florida, but it’s growth rate is substantially higher with a doubling time of 15 days compared to Florida’s doubling time of 22 days. For some perspective on what that means, if both states maintained their current growth for 30 days, Florida would be at about 250% of its current cases while Arizona would be at about 400% of its current cases.
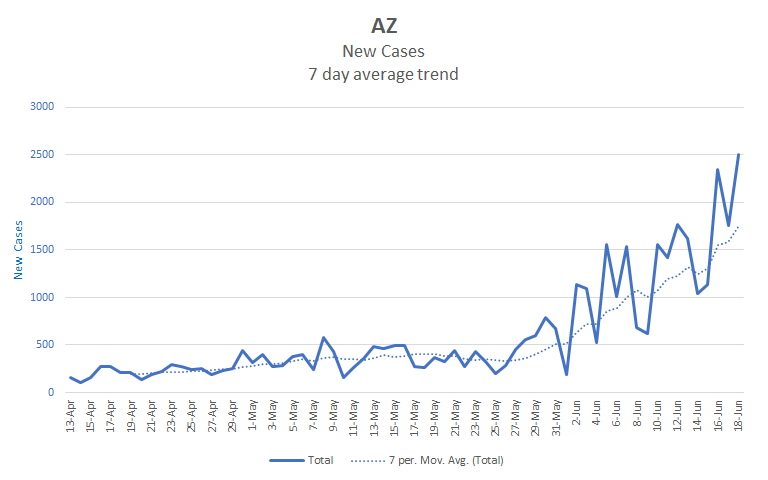
Arizona has one of the highest rates of growth in states with fairly large populations.
There are other states to watch, but the preceding five seem the most worrisome to me. Washington and North Carolina both have rising numbers, but their growth rates seem to be stable overall and neither has the growth potential or other difficulties that California has.
Here is a 10 day projection for the national numbers. As expected, the numbers are all revising upwards a little as we see increasing rates of growth. For example, the projection for the 26th has added about 15,000 cases to the previous projection.
| Day | Cases | Deaths |
| 6/18 | 2,190,900 | 118,431 |
| 6/19 | 2,213,739 | 119,131 |
| 6/20 | 2,236,588 | 119,830 |
| 6/21 | 2,259,438 | 120,530 |
| 6/22 | 2,282,288 | 121,229 |
| 6/23 | 2,305,137 | 121,929 |
| 6/24 | 2,327,987 | 122,628 |
| 6/25 | 2,350,837 | 123,328 |
| 6/26 | 2,373,686 | 124,028 |
| 6/27 | 2,396,536 | 124,727 |
| 6/28 | 2,419,385 | 125,427 |
I think it is increasingly clear that we will see rising numbers over the next month and particularly strong rises in the south and west of the nation. With a few exceptions, if you’re west of the Rockies or south of the Mason Dixon line, be prepared for the numbers to increase markedly over the next month or more. Act accordingly.
In the meantime, Happy Juneteenth everyone. May we forever look back on this Juneteenth as a time of sustained positive change for those our society has long oppressed. .