
New cases have continued to increase over the last few days, largely as anticipated. But while the nation as a whole sees slightly rising numbers, some states are rising alarmingly while others are steady or declining.
Today I’m updating the list of rising and non-rising states. Here is how I see them as of this morning. Again, I’m not applying a fancy algorithm to make the distinctions, just looking at graphs and making a judgment call. Some of the calls are obvious, but others are borderline and someone might make them differently.
Rising
Arizona, California, Delaware, Florida, Georgia, Hawaii, Idaho, Kansas, Missouri, Montana, Nevada, Ohio, Oklahoma, Oregon, South Carolina, Tennessee, Texas, Utah, Washington,
Non-Rising
Alabama, Alaska, Arkansas, Colorado, Illinois, Iowa, Kentucky, Louisiana, Michigan, Minnesota, Mississippi, Nebraska, New Mexico, North Carolina, North Dakota, South Dakota, Vermont, Virginia, West Virginia, Wisconsin, Wyoming, Connecticut, DC, Indiana, Maine, Maryland, Massachusetts, New Hampshire, New Jersey, New York, Pennsylvania, Rhode Island.
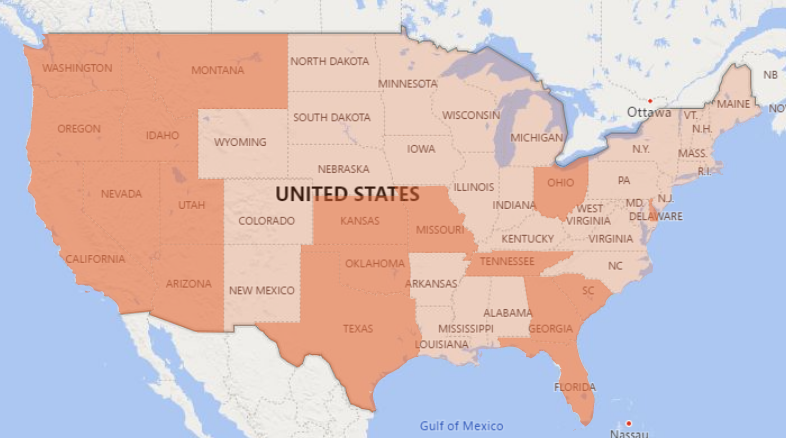
There have been a few changes to these groupings. Overall the Rising group has gotten smaller. 7 states – Alaska, New Mexico, Arkansas, Alabama, North Carolina, Kentucky and Vermont – are no longer clearly rising. 3 states – Kansas, Ohio, and Delaware – have begun rising in the last week. So we’ve gone from 23 rising states down to 19. Here are the rising states in darker shading. Hawaii is not shown on the map but is also rising.
As I’ve mentioned, the problem is that even though the majority of states are steady or decreasing, they can only decrease to zero while the rising states can rise much higher. To illustrate this, consider that as a group, the 19 rising states contributed an average of 18,092 cases per day over the last week. Over the same period, the 32 non-rising states (I’m including Washington DC) averaged only 8,345 cases per day. Moreover, the rising states are increasing their daily numbers more than other states are decreasing theirs. Over the last week the rising group has averaged about 800 more new cases each day than the previous. During the same period, the non-rising states added about 150 fewer new cases each day than they did the previous. In short, the group of 19 rising states are outpacing the rest of the states and are now largely controlling the national numbers, much as New York and New Jersey controlled the national numbers in April.
Let’s look at some graphs to show this more clearly.
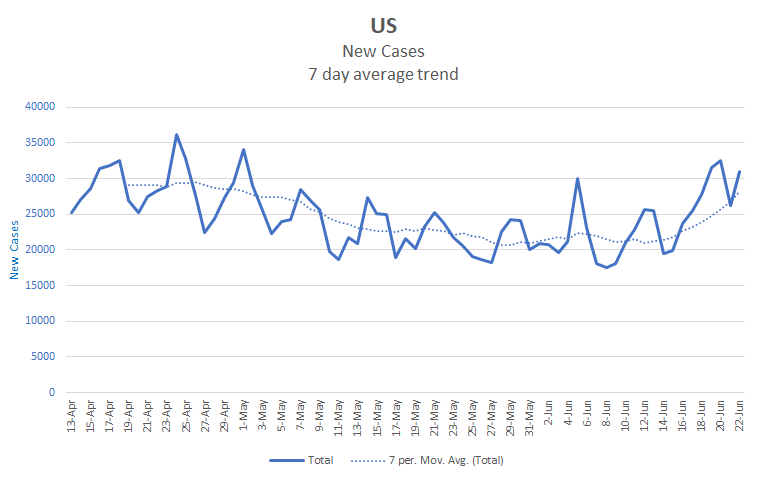
Here is the graph for the nation as a whole. You can clearly see that the numbers changed from declining to more or less steady on about the 28th of May. They then changed from steady to rising on about the 12th of June. Looking at the dotted line for the 7 day average, you can see that we’ve added about 28,000 cases per day over the last week. This is roughly the rate at which we were adding cases in mid-April and we are still rising.
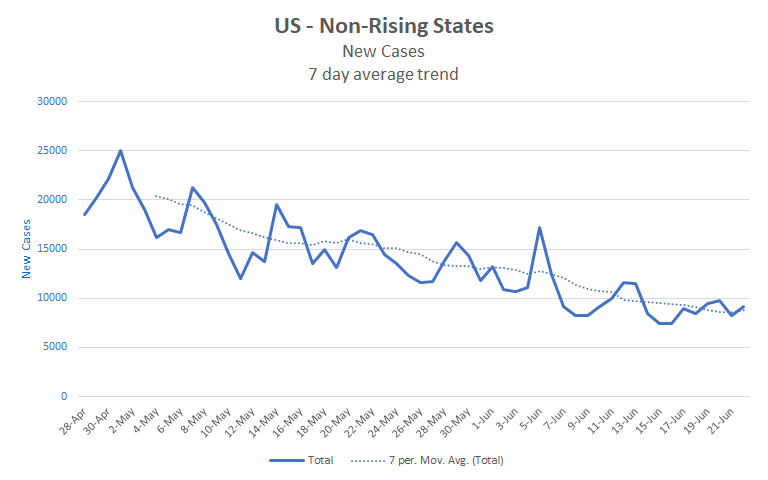
Next, here is the graph for the non-rising states. This group shows a relatively steady decline in new case numbers throughout the graph. As a group, these states have added about 8,000 cases per day over the last week.
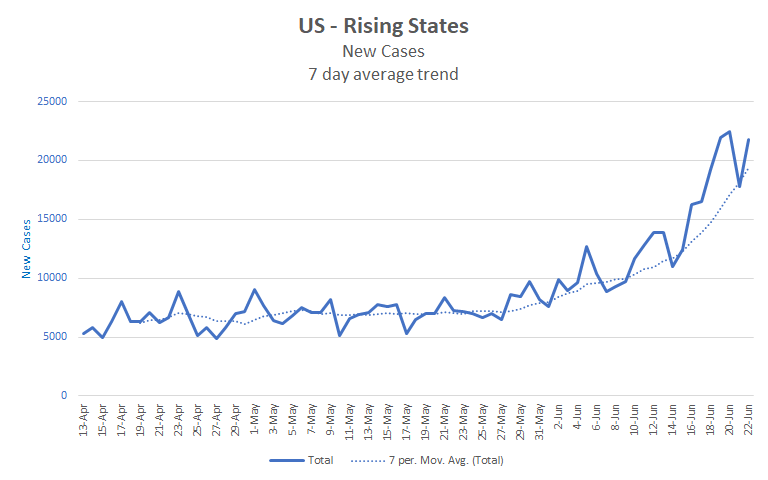
Finally, here is the graph for the rising states. This group was more or less steady until about the 28th of May and has been rising ever since. From the upward swoop of the curve since then, we can see that the group’s numbers have been rising faster and faster.. Even though there are only 19 states in this group, they account for nearly 70% of new cases.
So the national shift from declining, to steady, and finally to rising, can be read as largely due to the effect of a small group of states rising exponentially while the majority of states steadily decline.
In fact, just four states, Arizona, California, Florida, and Texas account for about 60% of the daily cases nationally. As a group, these four states’ cumulative cases are growing at about 3.5% per day. At this growth rate, this group of states would add about 450,000 cases over the next 3 weeks. Combined with the rest of the country we are on track to top 3,000,000 cases nationally by mid July.