
The national numbers have been mostly steady for a couple of weeks now. However, the nation is not homogeneous. Some states are doing well, others are doing very poorly. Overall, these have balanced out over the last week. To get a clearer picture of this, I’m going to divide the country into the states with rising numbers and those whose numbers are steady or falling. First, let’s look at the graph of the nation as a whole. Focus on the dotted trendline showing the 7 day rolling average, it smooths out the noise in the weekly cycle.
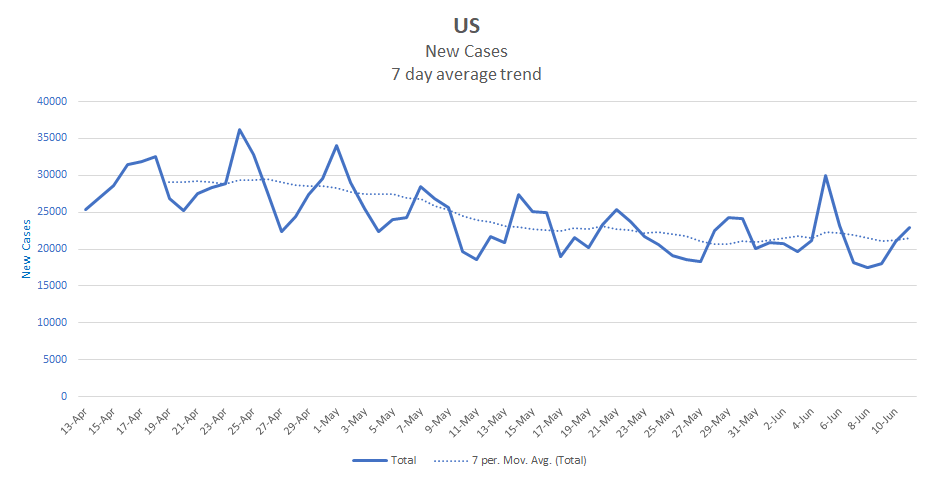
We see a decline from mid-April through mid-May and relatively stable numbers since then.
Next, let’s collect those states with rising numbers over the last few weeks in one group and the rest of the states in another. I’m not doing anything fancy to make the determination, just looking at the rolling average and making a judgment call about whether it has been rising or not since around the 25th of May. I haven’t included any US possessions in these groups but I have included Washington DC.
Here’s a map of the contiguous US with the rising states shaded darker. It shows a clear divide between areas of the country that are rising and those that aren’t.
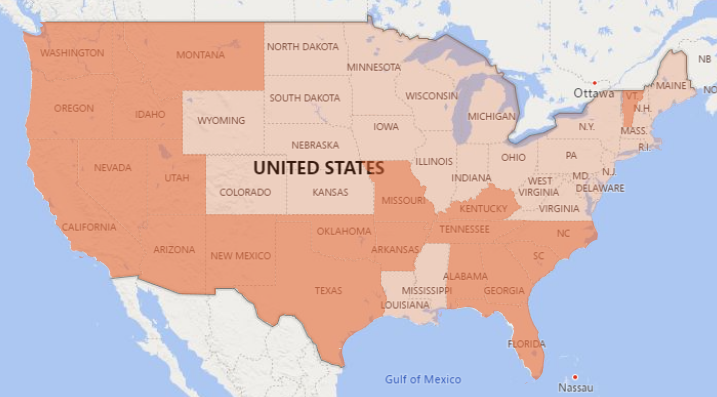
Alaska and Hawaii are also rising but I’ve left them off to make the map easier to read. You can see that the states in the south and west are generally rising while those in the north and either central or east regions are not. The exceptions to the pattern are Louisiana, Mississippi, and Vermont. The contiguous nature of the blocks highlights that the virus is regional, not just state by state. Utah and Idaho have little political commonality with Washington and California, but all four states are rising. This means that the potential for outbreaks spreading to other areas remains high throughout the border between the two regions. States that border on a rising region should probably exercise extra caution in reopening as there is significant risk. Colorado, for example, might see an influx of infections from neighboring states if it opens too quickly, while Minnesota is less likely to. is in a similar position, its neighbors to the south and west are all rising.
I’ll start with the rising group. This group includes 23 states: Alabama, Alaska, Arizona, Arkansas, California, Florida, Georgia, Hawaii, Idaho, Kentucky, Missouri, Montana, Nevada, New Mexico, North Carolina, Oklahoma, Oregon, South Carolina, Tennessee, Texas, Utah, Vermont, and Washington. Here’s the graph.
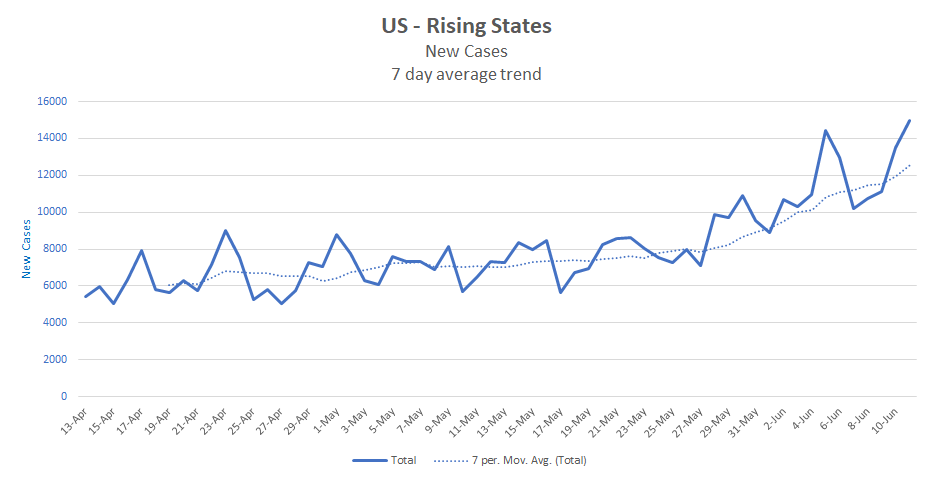
As a group, these states had been rising slowly but really started to take off around the 25th of May. Since then, the group has been accelerating at a rate of about 334 cases per day. That is, on average, each day the group adds 334 more new cases than it did the previous day. Over the last few days, it has averaged around 12,000 new cases per day.
Now let’s look at the states that aren’t rising. This group includes 27 states and Washington DC. Specifically, Colorado, Connecticut, Delaware, DC, Illinois, Indiana, Iowa, Kansas, Louisiana, Maine, Maryland, Massachusetts, Michigan, Minnesota, Mississippi, Nebraska, New Hampshire, New Jersey, New York, North Dakota, Ohio, Pennsylvania, Rhode Island, South Dakota, Virginia, West Virginia, Wisconsin, and Wyoming. Here’s the graph.

As a group, these states’ numbers have been steadily declining since late April. Since May 25th, this group has been decelerating at about 307 cases per day – each day the group adds 307 fewer cases than it did the previous day. Over the last few days, this group has averaged around 9,000 cases per day.
What can we learn from this comparison?
Here are a few notable points:
1) Most of the daily national cases come from the rising group, 12,000 vs 9,000.
2) The rising group has 54% of the total population.
3) The rising group is accelerating slightly faster than the non-rising group is decelerating. +334 vs -307 cases per day.
4) While the non-rising group has been decelerating at a relatively constant rate, the rising group has seen increasing acceleration over time.
Should these patterns continue, the effect of the rising group should become increasingly notable in the national numbers. The rising group already accounts for roughly 60% of daily cases in the nation and is accelerating more quickly than the non-rising group is decelerating.
The biggest takeaway, however, is simply that the virus continues to be active and growing in large portions of the country even while it is steady or subsiding in others.
One reply on “A Tale of Two Countries”
[…] few days ago I looked at the difference between the states whose daily new cases are currently rising versus thos…. Here’s the % growth graph for the group of non-rising […]