
Recently, my posts have focused on the number of cases added each day rather than on cumulative totals or percentage rates of growth. Today I’m going to return to looking at percentage rates of increases so the graphs will look a bit different than they have.
Why Switch?
Infections want to spread exponentially – the more existing cases are already in a population, the more new cases will be added each day. So, for example, if each day adds 5% to the total, then a day that starts with 100 cases will add 5 cases, but a day that starts with 10,000 cases will add 500. This means that infections tend to snowball, growing ever faster. At the beginning of the pandemic, paying attention to percentage growth gave us a better picture of where the numbers were likely to head.
At some point, social distancing rules put enough pressure on the spread of the virus that it wasn’t able to spread as quickly. At that point, we started adding about the same number of cases per day rather than a percentage of the total. So, at that point it made more sense to look at the actual number of cases added rather than seeing them as a percentage of the total.
Portions of the country now seem to have switched back to exponential growth. This is extremely worrisome as those areas are now at risk for snowballing in a way that erases many of the gains we have made in the national numbers. I’ll explain below.
An Ideal Case
Let’s start by looking at New York State.
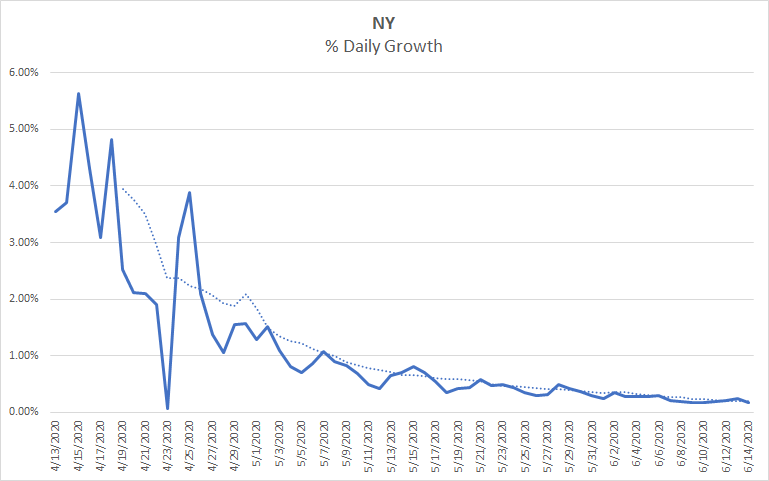
This is what we want to see in this type of graph. In mid April, New York cases were increasing by over 4% per day. Since that time, the rate of increase has steadily declined. While the decline has flattened somewhat over the last few weeks, it continues to approach 0%, which is as low as it can go. This is about as promising a graph as we can hope for short of entirely eradicating the virus. Even if New York were to decrease to adding only 1 case per day, it’s graph would never quite reach 0%, though it would get closer and closer as that 1 case would be a smaller percentage of the total each day.
A few days ago I looked at the difference between the states whose daily new cases are currently rising versus those that are either steady or declining. Here’s the % growth graph for the group of non-rising states.
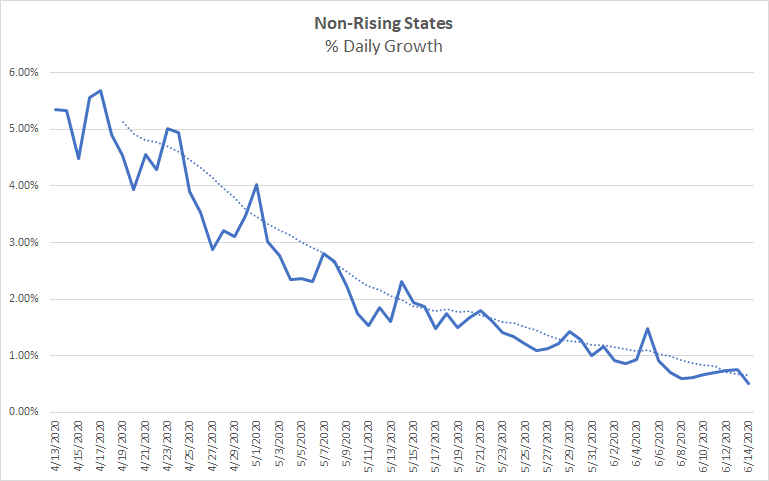
It looks a lot like New York’s graph, but is less steep and hasn’t dropped quite as far. On June 14th, New York grew by just less than 0.2% while the rest of the group grew by about 0.5%. When the growth rate is declining, as it is in the graphs we have seen so far, it can make more sense to see the growth as adding a certain number of cases each day rather than adding a certain percentage of the total. This is why I started focusing on the daily case numbers after we started seeing consistent decline in growth rates.
Doubling Periods
When something is growing exponentially, it’s rate of growth determines the amount of time it takes for it to double in size. Let’s use the group of non-rising states as an example. On June 14th this group of states had a cumulative total of 1,442,424 cases. On that day they added 5,914 new cases which was 0.42% of the previous day’s total.
Suppose this group of states added the same number of cases, 5914, every day from here on out. It would take 244 days for the group to double its total – to add another 1,442,424 cases. It would add that same number of cases again in the next 244 days after that. Its percentage growth rate would go down a bit each day as 5914 cases would be a slightly smaller percentage of each new total.
On the other hand, suppose this group added 0.42% of it’s total every day. On this scenario it would double its total in just 165 days. Worse, in the following 165 days it would add twice as many! Each 165 day period would add twice as many cases as the previous one. This is because as the total number of cases grows, so does the number of cases represented by 0.42% of the total.
When something grows exponentially, it doubles its size in the same period rather than just adding a certain amount in the same period. At 0.42% per day, the doubling period is 165 days.
Rising States
Now let’s look at the group of states whose daily case numbers have been rising. Here is the graph of the percentage growth of the group.
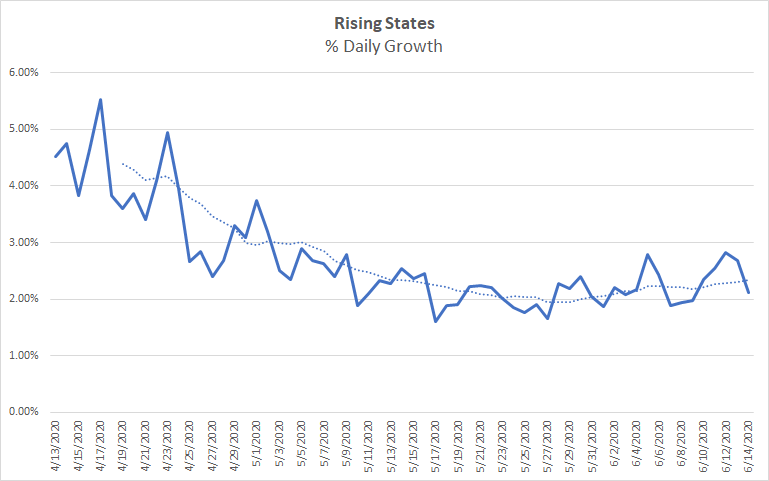
There are two important things to notice here. First, on the 28th of May the group switched from declining growth rates to increasing growth rates. Second, the current growth rate for these states is above 2%, more than 5 times as high as the non-rising states.
The Switch
Focusing on growth rates helps highlight exactly when this group of states started to increase. For comparison, here is the graph of new cases per day for the same group.
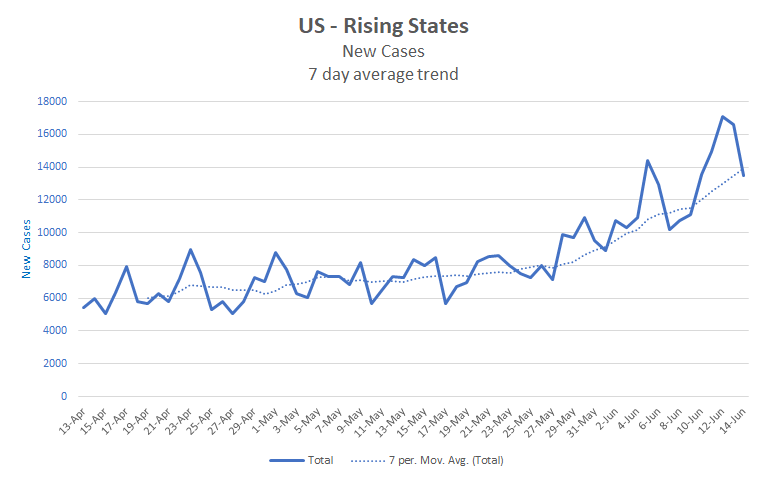
The change is less stark in this graph. We see rising numbers throughout and it’s less clear just when they become worrisome.
The Rate
Over the last week, the group of rising states has averaged a 2.35% growth rate. This is much lower than the rates we saw early in the pandemic. When I started writing about the numbers in mid March we were seeing growth rates of 50% or more! Of course we were starting from much lower numbers, so the actual numbers were lower than they are now. Also, we were just ramping up testing, so a fair bit of the growth was simply discovering already existing cases. Testing levels have been comparatively steady over the past few weeks. In late March, we were doubling our numbers every 3 days or so. The doubling rate for 2.35% is about 30 days, ten times as long. But even this rate is concerning, let’s take a look at why.
Suppose that the case numbers for this group of states continues to grow at 2.35% per day. That means that every 30 days, the cumulative total for this group would double. The group’s current cumulative total is 651,197 cases. It is now June 15. So, by July 15, the group would have added another 651,197 cases for a total of 1,302,394. By August 15, it would double again to 2,604,788. By mid September it would have more than 5 million cases, and by the end of the year this group would have more than 30 million cases. If the percentage rate continues to rise as it has recently, we could see the 5 million mark in August.
My point here isn’t to make a prediction about what will happen but to note how quickly this group could overwhelm the national numbers. Even if the growth rate were to stabilize at the current rates, this group could quickly become the majority of cases in the nation. If growth rates continue to rise, that will happen even more quickly. If the growth rate is left unchecked and allowed to rise, the numbers could dwarf current national numbers before the end of the summer.
Looking Ahead
So, will the growth rates continue to rise for this group?
One thing to remember is that the next two or three weeks are already baked in. Infections that occurred yesterday will mostly not be detected for some time if ever. Given the lack of widespread testing, still, there is likely a background increase of cases that is substantially greater than what we can see. So, while there is no guarantee, it’s reasonable to expect that growth rates will continue to rise for the next few weeks just on this basis.
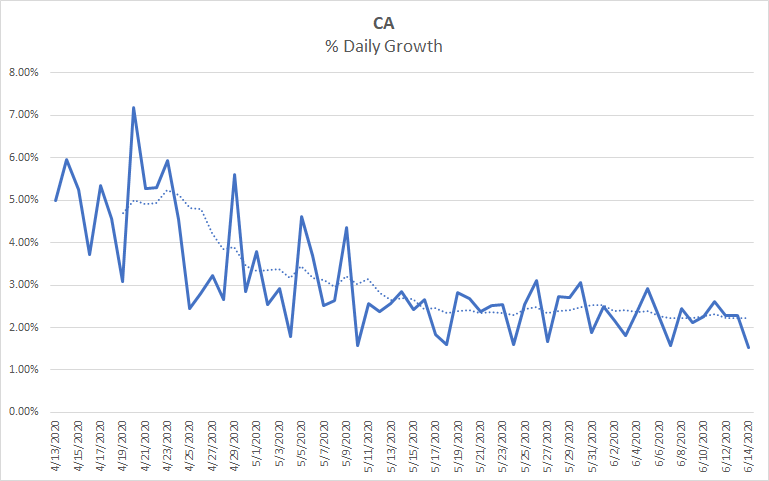
Another point is that there seems to be little political will to implement restrictions to curb the growth rates. Oklahoma and Florida are both rising, Florida alarmingly so. However, both have recently agreed to allow large indoor political events that are likely to increase the spread of the virus. California has stricter social distancing measures than most in this group, but they have only managed to stabilize their growth rate, not to decrease it.
Even if all the other states in the group adopted California’s level of restriction, the result would likely be stabilization at a higher growth rate rather than a decrease in the rate.
So, for at least the next few to several weeks, we seem to have a significant number of states in an exponential growth phase. The growth potential of these states exceeds the amount of decrease that can be achieved by the non-rising states as many already have very low percentage growth rates. Thus, we should expect national daily case growth to increase and to accelerate over the next month and potentially longer. Just how long depends on a myriad of political and non-political factors, but it seems unlikely that anything would significantly restrict the growth prior to August. The summer is thus likely to see increasingly rapid growth and increasing political rancor surrounding that growth. This isn’t the much talked about “second wave”, it’s just an extension of the first wave. I recommend considering how you can best prepare for these rapidly increasing numbers, especially if you live in a state with rising numbers.
I’m going to skip the 10 day projection today as I want to take some time to consider how to account for the rising growth in it. I’m happy to entertain questions or requests for specific graphs in the comments.