
I spent the last couple of days revamping my data setup. I’m now pulling from a more informative data set that lets me drill down to the county level and adjust by population. My charts may look slightly different but should be recognizable to those who are used to seeing them.
Cases continue to skyrocket. The last two day have been over 140,000 and the 7 day average now stands at 127,474. A week ago, the 7 day average was 94,453, so over the past week we have seen a 35% increase in case rates. The previous week saw a 27% increase, so we are continuing to accelerate rapidly.
Deaths are starting to skyrocket also. 2005 deaths were reported yesterday, though this includes a spike in Georgia that looks like it may be reporting some deaths that occurred earlier. Adjusting for that spike brings the daily deaths down to 1532 yesterday for a 7-day average of 1070 deaths per day. This is a 24% increase over the last week. The previous week saw only a 9% increase. Deaths are really starting to accelerate.
Here is the national graph starting March 1 to give an idea of how the stats compare to earlier surges.. Keep in mind that it includes the Georgia spike on the death line.
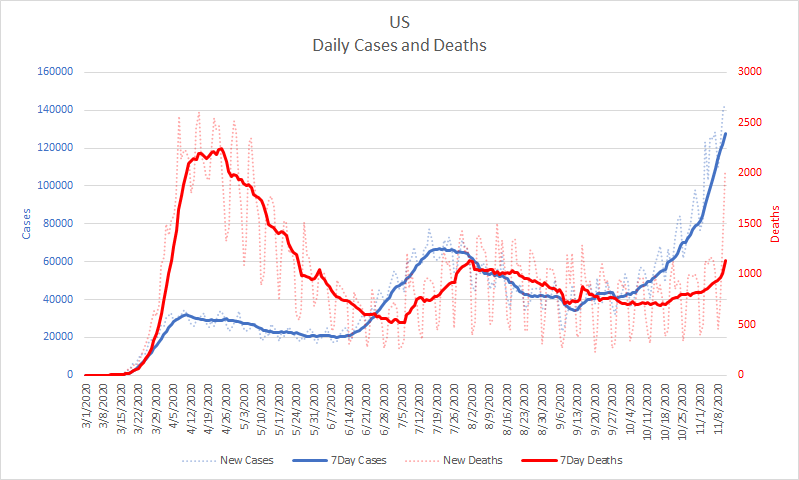
There’s simply no way to spin these numbers as good. Reports have started coming in about hospital systems being overwhelmed. For example, North Dakota has started allowing COVID-infected nurses to continue working as they would otherwise not have adequate staffing.
Infections continue to be centered on the Dakotas. Here is a map showing 7-day average cases per 100k population.
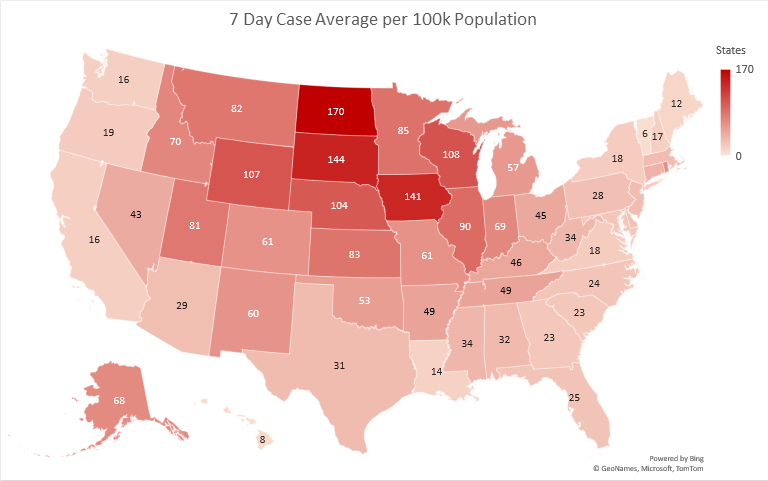
I want to highlight that even the lightly shaded states are not doing that well. For example, Vermont has the lowest per capita rate in the nation. Nonetheless, yesterday it reported its highest number of cases ever. Washington has a comparatively low rate of 16 per 100,000 population, but here is what its graph looks like.
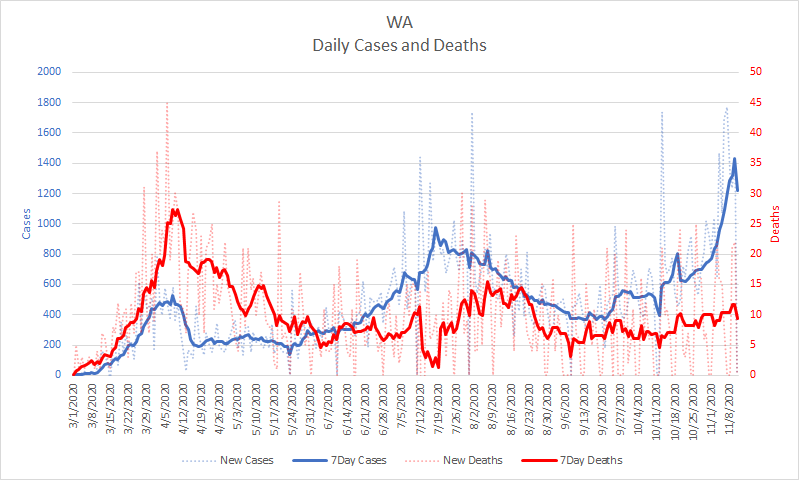
Compared to other states at the moment, Washington is less hard hit, but it’s still harder hit than in either of the prior surges.
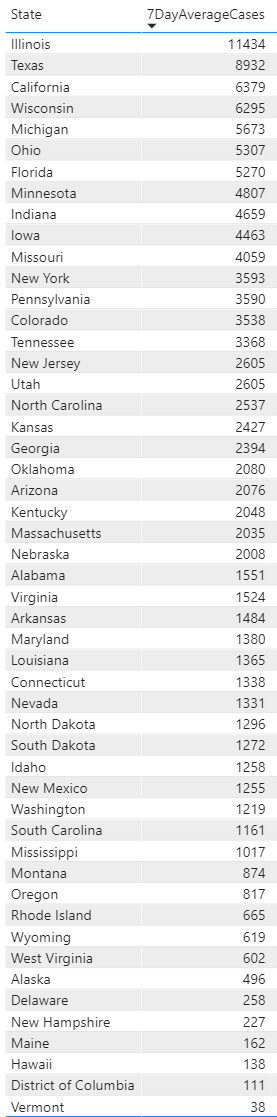
There are now 39 states with a 7-day average of more than 1000 cases per day. Here is a list of each state and their 7 day average.
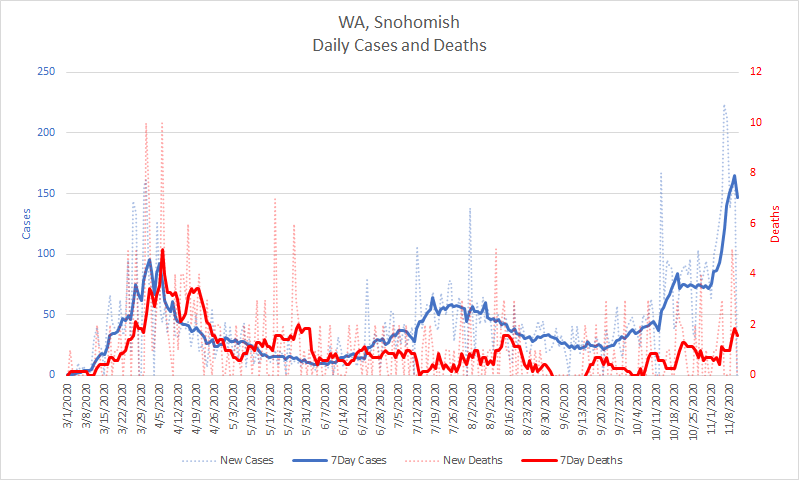
Finally, just to highlight that I now have access to county level data, here is the graph for my home county of Snohomish in Washington.
I’m still working on how best to incorporate this data and also how to best access data on hospitalizations. I’m happy to take inquiries and suggestions about data presentation in the comments.
To wrap up. Things are very bad and getting worse. As we head into the holiday season, cases and deaths are both surging. Hospital systems in some locations are beginning to be overwhelmed. It’s 6 weeks until Christmas. Even at current rates more than 45,000 people will die of COVID between now and then. At the rate we are accelerating, the number will be far higher. Each of those deaths is a family member who will now be missing from whatever holiday the family celebrates this season.
Stay safe. Be kind to others and help them stay safe also.