
Nationally, the virus numbers continue along the same path. We’re seeing a broad pattern of increasing infections and deaths across the country. About three quarters of states are reporting rising daily case numbers and half report rising daily death numbers. Of those that aren’t rising, only a handful report falling numbers in either category.

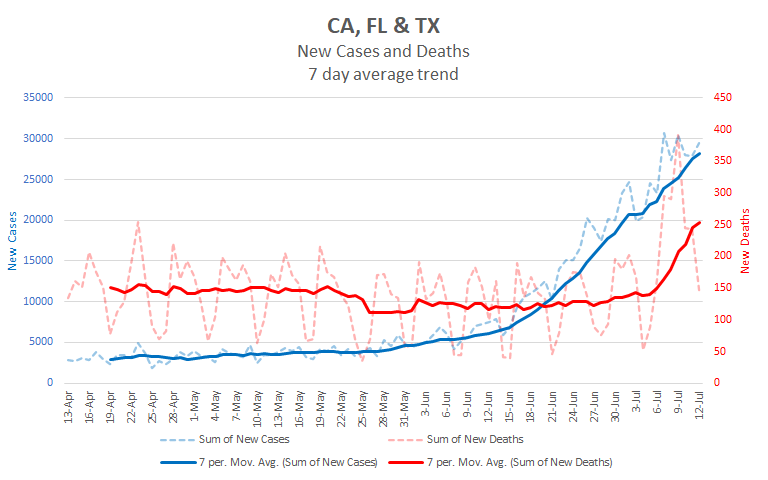
Florida, Texas, and California account for about half of new cases each day, though for only about a third of new cases. Florida and Texas have each averaged nearly 10,000 new cases per day over the last week. Notably, on Sunday Florida posted the highest daily case number for any state since the pandemic began, 15,300 new cases. It has already followed that up with a report of 12,636 new cases on Monday. The extremely fast rise of Florida and Texas suggest a large background of undetected cases. This seems similar to what happened in New York. If so, that will make it more difficult to bring the infection rate back under control. New York was very aggressive in its approach and still took more than three weeks before its case numbers subsided significantly. Neither Texas nor Florida have indicated that they are willing to take the sort of actions that New York did, so this may take longer to resolve. A lot depends on how the people in each state respond to the rising numbers in absence of compelling intervention by their governors.
Beyond the three states mentioned, 9 others have case numbers averaging more than 1,000 per day. Arizona and Georgia lead this group with more than 3,000 each. In good news, Arizona’s case numbers may be leveling off. They’ve been fairly steady in the mid-3000s since the beginning of the month. Georgia, on the other hand, continues to see rising case numbers. Deaths are rising in both states. The remainder of the over 1000 group consists of Louisiana, North Carolina, South Carolina, Tennessee, Alabama, Ohio, and Illinois.
Here is a chart of the numbers for all states with a 7 day average of over 1000 for new cases per day. As a group, these states are responsible for about two-thirds of cases and deaths each day.

It’s not clear what’s driving the sharp increase in deaths since July 4th. Several states saw spikes within a few days following July 4th, after reporting low numbers over the holiday weekend. These states seem to be concentrated in the over 1000 group. The spikes stand out in the two limited graphs above, but aren’t that notable in the national graph. Nonetheless, the fact that yesterday’s numbers are still more than twice as high as the previous Sunday’s indicates that this rise is largely real rather than just noise from reporting schedules.
Our national percentage rate of growth continues to rise slowly. A week ago we were growing at 1.80%, this week we’re at 1.94%. I’ve adjusted the growth rate slightly in the projection to account for that growth. Here is what the numbers may look like over the next ten days. Not that we’re looking at 4 million cases by the middle of next week. The real question going forward is how quickly the national daily death rate will rise. We’re already seeing a sharp rise in deaths in the states with the most cases, but this hasn’t yet translated into a similarly sharp rise in the national numbers. My expectation is that we will begin to see that translation over the next week to ten days, but that’s mostly just an educated guess.
| Day | Cases | Deaths |
| 7/12 | 3,304,790 | 135,202 |
| 7/13 | 3,370,886 | 135,658 |
| 7/14 | 3,438,304 | 136,113 |
| 7/15 | 3,507,070 | 136,568 |
| 7/16 | 3,577,211 | 137,023 |
| 7/17 | 3,648,755 | 137,478 |
| 7/18 | 3,721,730 | 137,933 |
| 7/19 | 3,796,165 | 138,388 |
| 7/20 | 3,872,088 | 138,843 |
| 7/21 | 3,949,530 | 139,298 |
| 7/22 | 4,028,521 | 139,753 |