
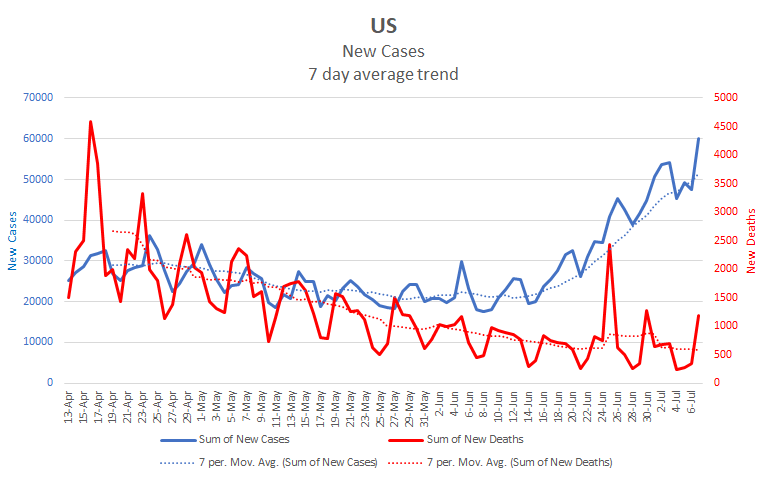
We’ve reached 3 million cumulative cases on all the trackers now. As expected, the numbers were a little noisy over the holiday weekend with different trackers showing somewhat different numbers. The Johns Hopkins tracker registered more than 60,000 cases yesterday, a record number. 1point2acres and worldometer showed lower numbers yesterday but higher numbers the previous two days. Whichever tracker you use, it’s clear that cases continue to rise nationally and that almost all states are seeing increases in daily case numbers. There is more noise in the daily deaths numbers, so it’s harder to know exactly what is happening with them at the national level. My best guess is that numbers have leveled off and may have just started to rise. We’ll need to wait a few more days to see whether that interpretation is borne out in the coming numbers. Here is the national graph as of last night.
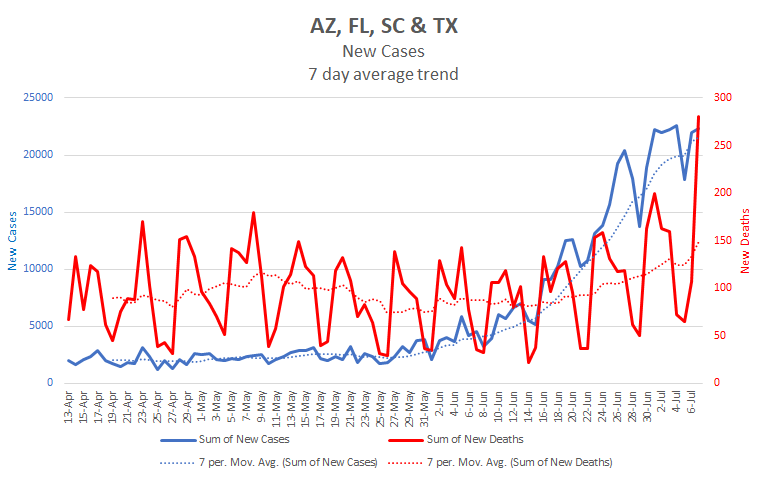
At the state level, deaths are increasing in many states, especially those that have seen some of the worst recent increases. Here, for example, is a combined graph for Arizona, Florida, South Carolina, and Texas. In it, we can see a lag of a bit more than three weeks between when cases started to rise and when deaths started to rise.
At the same time, there are states that have seen rising case numbers for at least three weeks yet don’t see increasing deaths. California is perhaps the clearest example of this type. Its case numbers have been rising since April while it’s death numbers have been declining over the same period.
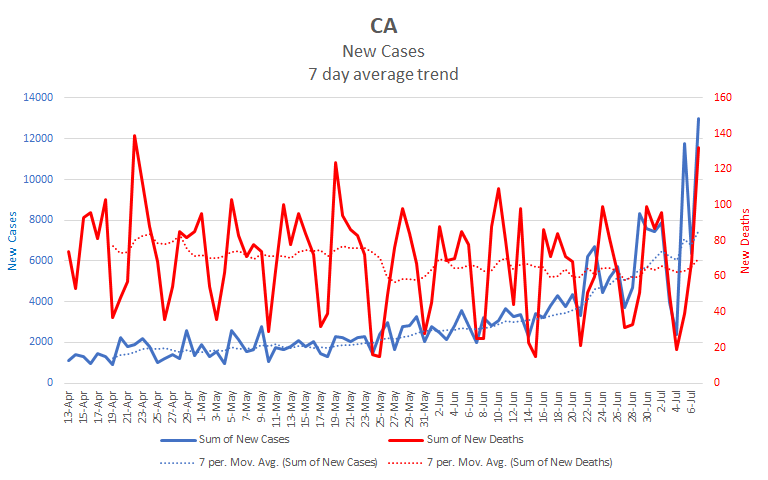
I don’t know what accounts for the difference in states such as California. The expectation is that death rates should generally follow case rates with about a 3 week lag, and that death rates should increase even more once hospital systems become stressed or overwhelmed. Many states started growing within the last three weeks, so we’ll have to wait and see what happens.
The national numbers are currently growing at about 1.85% per day based on a 7 day average. If we continue to grow at this rate, we should reach 4 million cases by July 24th. Here is a projection based on a 1.9% growth rate for cases. Our growth rate is still increasing, so I’ve bumped it up slightly in anticipation that the increase will continue at least in the short term. These numbers are for the Johns Hopkins tracker.
| Day | Cases | Deaths |
| 7/7 | 2,995,946 | 131,477 |
| 7/8 | 3,052,869 | 132,583 |
| 7/9 | 3,110,873 | 133,691 |
| 7/10 | 3,169,980 | 134,799 |
| 7/11 | 3,230,210 | 135,907 |
| 7/12 | 3,291,584 | 137,015 |
| 7/13 | 3,354,124 | 138,123 |
| 7/14 | 3,417,852 | 139,230 |
| 7/15 | 3,482,791 | 140,338 |
| 7/16 | 3,548,964 | 141,446 |
| 7/17 | 3,616,395 | 142,554 |
Stay safe and help others do the same.