
The big change over the last few days is that it has become apparent that most states now have rising case numbers. In fact, it is far easier to just list those that don’t. Here are the 14 states that are not rising.
Connecticut, DC, Maryland, Massachusetts, Nebraska, New Hampshire, New Jersey, New York, North Dakota, Oklahoma, Rhode Island, South Dakota, Vermont, and Virginia.
All other states are rising to some degree. Many states started rising in the last two weeks and are rising slowly, so the rise has only become clear in the past few days. Of the states that are not rising, only New Jersey and Rhode Island are falling. The rest are either steady or unclear.
I believe that what we’re seeing is the beginning of increases due to reopening in states that did not reopen as aggressively as, say, Texas and Florida. Texas and Florida started slowly increasing at the end of May and have grown exponentially since then. The worry is that the many states who are now rising slowly will continue to accelerate much as Texas and Florida have.
Nationally, cases have continued to rise markedly while deaths have been declining very slowly. The noticeable increase in cases started on about June 12, so we will probably see deaths start increasing over the next two weeks. The spike in deaths on June 25 is from New Jersey adding a bunch of earlier deaths to its records, not from deaths that occurred on that day. Remember that Cases are read from the blue numbers on the left of the graph and that deaths are read from the red numbers on the right.

Those are the daily cases. Another way to look at the rise is by seeing how quickly the cumulative cases are growing. As of this morning, the US has reported 2,590,400 cases of COVID total. Each day we add more to that. Here is a graph showing how our total case number has risen. Looking closely, you’ll see that the line curves up slightly over the last couple of weeks.
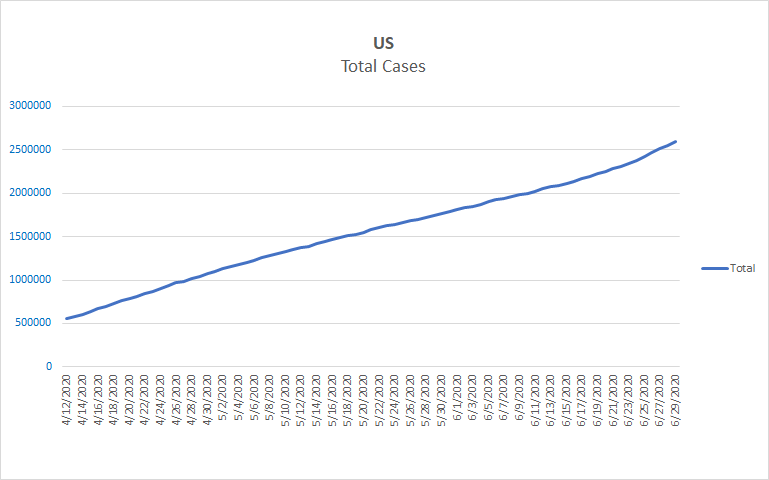
It’s not a great graph. It’s hard to see that curve and hard to understand what it means. It looks pretty mild, even though it really isn’t. The problem with this graph is that as our total numbers get bigger, each case added makes less and less of a difference to them. Yesterday we saw more than 41,000 new cases, more than we saw in any day prior to last week. If we had added that many cases in one day in early April, it would have made a huge difference as it would have been a 10% or bigger increase in the total. But now it’s only a 1.6% increase, so it’s not as noticeable.
Another way to look at this is to focus on the percent change each day rather than the number of cases. Here is a graph of that view.
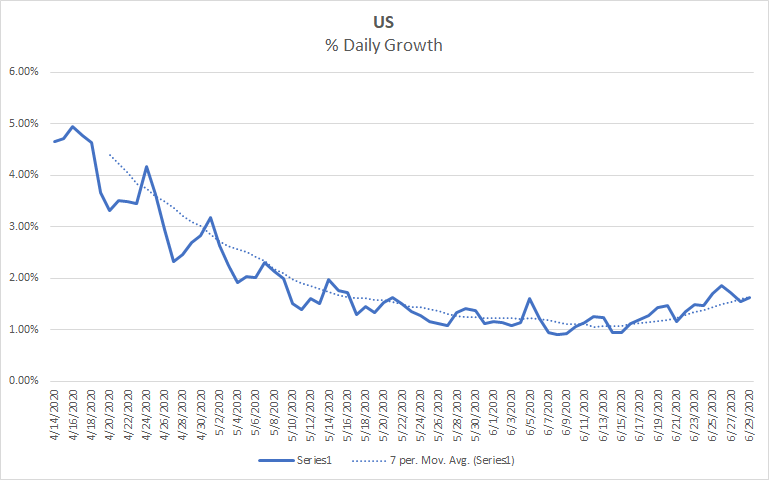
This graph shows the change more clearly. Focus on the dotted line. It represents the 7 day average, so it smooths out the weekly ups and downs. From mid April to mid June, the percent change tended to be lower each day than it was before. Since mid June, the percent change has tended to be higher each day. Over the last week, we added about 1.65% of our total cases each day. If we continued doing that, our total cases would double in 42 days. So on August 11, we would reach 5,180,800 cases, twice what we have now. 42 days after that, on September 22, we would be at 10,361,600. I’m not suggesting that we will stay at this rate, we probably won’t. I’m just showing that while 1.6% may seem small, it adds up quickly, that’s the nature of exponential growth.
In the short term, our rate of growth is increasing. A week ago we were only rising at 1.3 percent. So, in the short term, we are likely to grow faster than our current rate suggests. For example, at 1.64% growth, we should reach 3,000,000 cases in 10 days, on July 10. We will almost surely reach it sooner. At 1.64% growth we would reach 4,000,000 cases in 27 days, on July 27, I suspect we will reach it sooner also. If this seems alarming, it should.
We will continue to increase at alarming rates until we do something to slow the spread. The remaining question is when we will do that. At some point, the numbers will again be sufficiently alarming to a sufficient number of people that we will do something. A couple of weeks after that, we should see some results.
Viruses are easy to predict. Once you know a few basic parameters, you can pretty accurately guess how they will increase. People are hard to predict. Sometimes they will band together and accomplish amazing wonders. Other times they will refuse to take even the simplest steps to protect themselves and their loved ones. Yet other times they actively abuse, enslave and kill each other. I won’t pretend to guess how or when we may react. We know enough about the virus to know how it wants to spread and how to stop it. Our fate is in our hands if we choose it to be.