
40,000
The big news is that the nation passed 40,000 new cases in a day for the first time last night. That number is more than 10% above the highest numbers we saw in April. Here is the current graph for new cases.
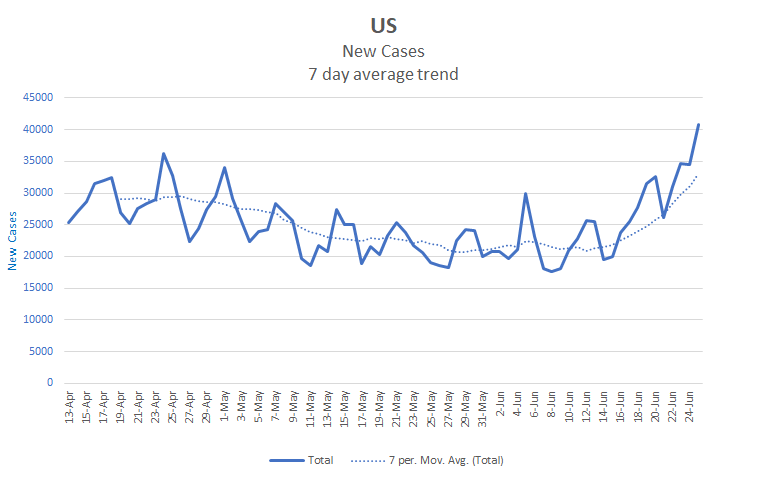
As you can see we’re still rising. Further, our rise is accelerating. I expect that to continue at least in the short term due to a variety of reasons. There is always a lag between someone being infected and the infection detected. Because of this, it takes time to slow or stop a rising period. Also, the measures being proposed in hot spots now are less drastic than those imposed by, say, New York, so they will take more time to have a noticeable effect.
Testing
There is a view that the rise we’re seeing is due to increased testing. Let me start by saying that the view is wrong. Yes, we are testing more than we were in April. So it’s not unreasonable to wonder if the real number of cases on April 24th was higher than the real number of cases yesterday due to increased testing. However, that increase in testing is not responsible for the current rise in daily cases.
First, the number of tests has risen steadily, even when new cases were declining. Here’s a graph showing the national testing, taken from 1point3acres.com . The height of the bars are the number of daily tests, with the orange portion representing positive tests and the blue portion representing negative tests. The red line shows the percent of tests that were positive.
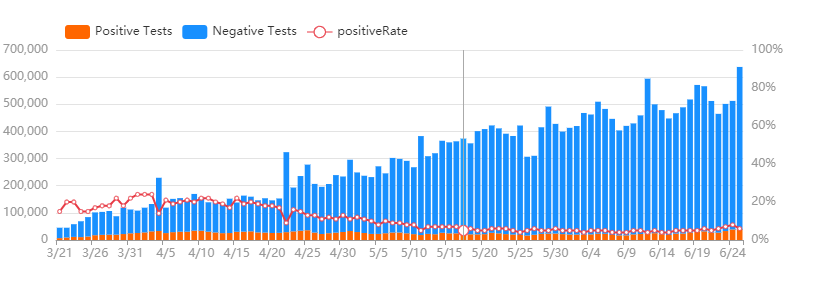
Cases started rising nationally on about June 12. There is no similar rise in testing in the period since then. Further, there is a rise in the percent of positive tests.
Tests represent a sample of the population. The sample is biased and non-random, but it’s still a sample. In general, we expect the percentage of positive results to stay about the same unless one of two things happens, either the bias in the sample changes or the percentage of cases in the population changes.
Bias changes when there is a change in who is tested. The high positive rates in March and April were in part due to tests being restricted to high risk and symptomatic people. Since then the tests have been opened up considerably, so it makes sense that the percentage of positives would drop as they became available to those less likely to be infected. However, there has been no recent change in bias that explains the recent rise in the percent of positive results. If the infection rate were constant, we would expect the percent of positive results to be either steady or decreasing, but not increasing.
If infections increase in the population, while the bias stays the same, then we expect the percent of positive results to rise. Absent some better explanation, this seems to be what’s going on here. This view is reinforced by the fact that we are seeing hospitalization rates increase in the hardest hit areas.
**The Big Three**
The situation on a state by state level has become increasingly complex. Some states that have been stable or decreasing show signs of rising. Pennsylvania is a good example here. However, it’s too soon to tell whether this is the start of a wave or just some noise in the data. Today I’m going to focus on what I call “The Big Three”, California, Florida, and Texas.
These three states are “Big” in multiple ways. They have the most daily cases of any states, some of the highest percentage increases, and also are the three most populous states. A little more than a quarter of the people in the US live in one of these three states. About 40% of yesterday’s new cases were in one of these states. Here’s a combined graph for them.
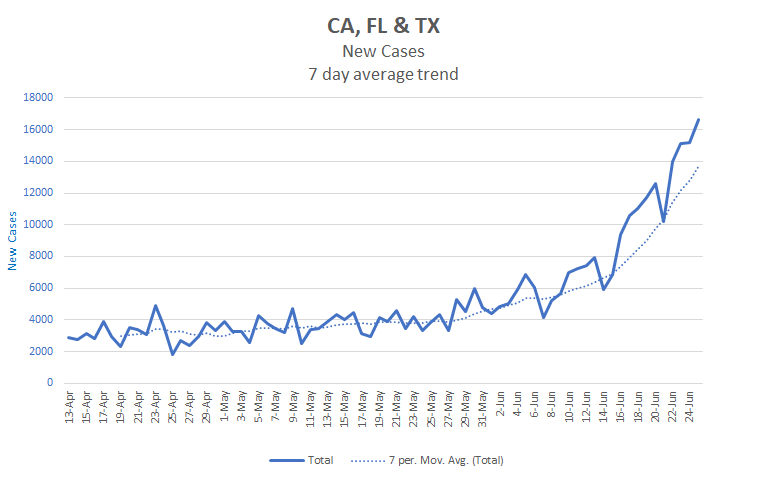
Right now, these three states are rising exponentially at a rate that has them doubling every 20 days. They have a total of 449,688 cumulative cases so far. So at this rate they will add that many more cases by July 16th. By itself, that increase would push the national numbers close to 3 million, the remainder of the states would easily push it over that mark. However, these three states are accelerating even at the exponential level, so their doubling period will probably be less than 20 days. I am fairly confident we will see national numbers above 3 million before mid July.
**Other States**
The Big Three are driving the national numbers right now, and will likely continue to do so over at least the next couple of weeks, just because of the sheer volume of cases they have and their huge potential for growth. However, there are many other states that bear watching. Here is a table of the states with the highest daily numbers yesterday.
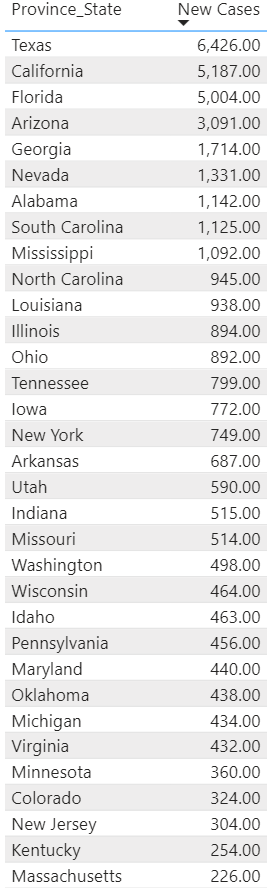
Any of the top ten or so states in this list is worth watching. Arizona is of particular note as its numbers are much higher than one would expect given it’s population. It is the 14th most populous state, but has the fourth highest number of daily cases by a large margin. Outside of the top ten, I’m also watching Utah and Washington as both are increasing substantially. As it turns out, I have family in both states, so there may be some selection bias on my part in watching them closely.
**Projection**
We’re already a full day ahead of the projection I did a couple of days ago – last night’s numbers were higher than those projected for tonight. As a result, I’m modifying the way I calculate the projection today. For Cases only, I’m using a compounding formula fitted to match the last few days rather than letting Excel’s algorithm do the work. This should give a more accurate projection in our current circumstances. Time will tell.
Here’s what the next 10 days will likely bring.
| Day | Cases | Deaths |
| 6/25 | 2,422,147 | 124,407 |
| 6/26 | 2,460,659 | 121,830 |
| 6/27 | 2,499,784 | 122,436 |
| 6/28 | 2,539,530 | 123,041 |
| 6/29 | 2,579,909 | 123,647 |
| 6/30 | 2,620,929 | 124,253 |
| 7/1 | 2,662,602 | 124,859 |
| 7/2 | 2,704,937 | 125,464 |
| 7/3 | 2,747,946 | 126,070 |
| 7/4 | 2,791,638 | 126,676 |
| 7/5 | 2,836,025 | 127,281 |
Be prepared for numbers to rise alarmingly over the next few week. Also be prepared for some states to drastically increase restrictions or even shut down. While there is a lot of political resistance to such measures, at some point the numbers will become sufficient to override that resistance. We’re already seeing that in the big three states.
Meanwhile, stay safe and do your part to keep those around you safe also.
Thanks for reading!