
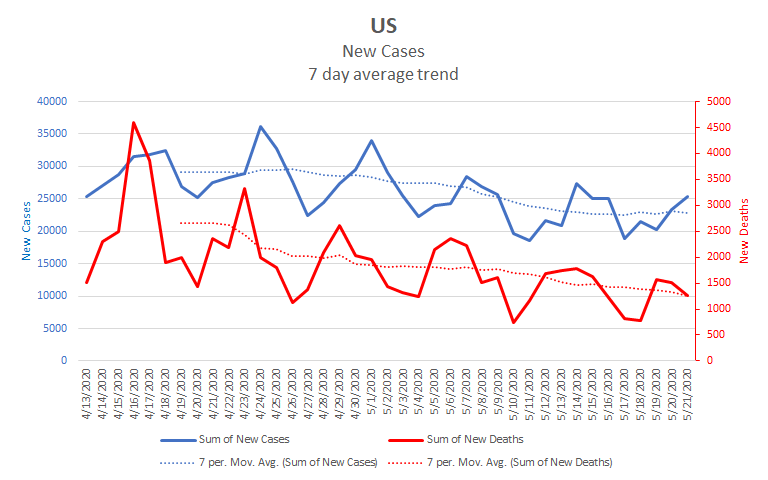
Some US states began reopening before the beginning of May and the rest have followed suit since then. We’ve been waiting to see the results of the reopening, and the numbers have finally stabilized enough to show them. The expectation was that reopening would result in more cases than remaining closed, and this is supported by the numbers we now see. At the national level, new cases per day have stopped decreasing and have been flat for the past week. New deaths per day are still decreasing, but should flatten in another week or so. The average time between infection and death is about 18 days, so we expect changes in death rates to happen about that much later than changes in infection rates.
This is a good point at which to pause and think about the future. The US has been social distancing at various levels for at least two months. Infectious diseases hate social distancing, so as a result COVID-19 cases have been below what they would have been without social distancing. I suspect many scholarly papers will be written in the future about these past two months as they provide an incredibly stark contrast to our usual behaviors. I expect we will find that social distancing has not only affected COVID-19, but also all manner of other communicable diseases. While they don’t make headlines, flu rates are probably lower than normal for this time of year. We’ve even reduced worldwide CO2 emissions by 17%.
As we reopen, we should expect the effects of social distancing to decrease. If we are exceedingly cautious, and very fortunate, we might keep the infection and death rates at about where they are now. They may rise, but neither COVID-19 nor CO2 levels are likely to decrease further as we reopen. Barring a vaccine or treatment, current rates represent a sort of best case scenario: what we can aspire to, or hope for, as we proceed.
We’ve leveled off at somewhere between 20,000 and 25,000 new cases per day. Let’s be optimistic and round that number down to 20,000. We’re currently at about 1,250 deaths per day, but we’ve got some time before these numbers level off. It looks reasonable to me to estimate the level rate at 1,000. What does the future look like if this is our best case scenario?
A look at the rest of the year
At 20,000 cases per day, each month will see an additional 600,000 cases. We will be at about 1,800,000 cases by June 1, so that puts the numbers at 2,400,000 by July, 3,000,000 by August, and 3,600,000 by September. Looking farther ahead, we would be at 4,800,000 cases by the election in November, and 6,000,000 by the new year.
By the end of May, we’ll have seen over 100,000 total deaths. If we continue at 1,000 deaths per day, that’s a total of 130,000 by July, 160,000 by August, and 190,000, by September. The November election would see 250,000 dead and the new year would dawn with at least 310,000 having died in the US.
In very rough terms, this would mean that over the course of 2020, approximately 0.1% (1 out of every thousand) of the US population would have died from COVID-19, and around 2% would have been sickened. The background death rate in the US varies from year to year, but is usually in the neighborhood of 0.8%, so we would see about a substantial increase in deaths overall. The two leading causes of death, heart disease and cancer, each kill about 0.15% of the population each year. This rough estimate would put COVID-19 as the third leading cause of death for 2020, killing about 2/3 as many people as heart disease and cancer each typically do and about twice as many as “unintentional injuries”.
These are big numbers and, on the surface, they can seem abstract and impersonal. I find that it helps to think about them on a more local scale. Think about the town or city you live in. What is its population? What will it be like for 2% of that population to have been infected and 0.1% to have died from COVID-19? I live in a town of about 5,000. So for me, that’s 100 people infected, and 5 dead. We’re a smallish town, we notice when someone dies. Five extra deaths in a year would make an impact. One hundred people sick with a potentially life threatening illness would be felt. Some of those people might work at the hardware store, others at a restaurant or the post office, they would be neighbors and friends, not just numbers or marks on a graph. The Seattle metro area nearby is home to about 4 million people. That translates to 80,000 infected and 4,000 additional deaths this year.
Caveats and Assumptions
Remember, all of this is a best case scenario. It assumes that we manage to hold infections and deaths at roughly their current rates for the rest of the year. That means no spikes, no second waves, and everyone continues to social distance as well as they currently are. These are probably unrealistic assumptions. Experts are warning about a second wave and there are many reports of people not following guidelines during reopening. These things would lead to higher numbers, perhaps much higher.
Another point is that these are national rates, local numbers will vary considerably. New York City has already seen numbers in excess of what these rates suggest. In general, I expect rural areas to fare better than metropolitan areas, but also that there will be a lot of variation within each group. Some rural areas may get hit hard, some cities may not.
It is important to note that these are just the reported numbers. The actual numbers are almost undoubtedly higher. As we move forward, we may see increased political pressure resulting in even less accurate reported numbers. Right now, the fatality rate for reported cases in the US is about 6%. That is substantially higher than many estimates of the real fatality rate. New York and New Jersey had high fatality rates due to having overwhelmed healthcare systems. If we can avoid overwhelming our healthcare systems, we may keep deaths lower than this scenario. Still, the fatality for the US, excluding New York and New Jersey, is about 5%, so there is a limit to how much we can reduce the number of deaths without an effective treatment.
Finally, this scenario assumes that no effective vaccine or treatment will be available before the end of the year. While the White House has set a goal for a widely available vaccine by the end of the year, most experts see this as unlikely. There are plenty of vaccine candidates, but getting them through testing and production is expected to take longer than the end of the year. Each candidate has to clear many hurdles before approval and then even more to ramp up production to the required levels. Even if the White House goal is met, it would be very unlikely to substantially impact the numbers prior to, say, November. Finding a successful treatment, especially one that is readily available, is probably our best shot at seeing lower death rates before the end of the year. There’s been some recent suggestive news on that front.
A recent study found that COVID-19 comes with a unique impact on our immune systems. In a nutshell, it severely hampers the initial immune response while increasing the second stage response. Hampering the first stage response allows the virus to reproduce quickly. Increasing the second stage response is likely the source of inflammation and and cytokine storms that have caused serious medical problems. If we can find a way to increase the effectiveness of the first stage without further increasing the second stage, that might help in early treatments. Stat has a good summary of the study, and Derek Lowe covers it in his blog. To my very unexpert eye, this is the most promising opportunity for an effective treatment that we’ve seen. If this, or some other, discovery can be leveraged into an effective treatment, we could see numbers below those suggested by this scenario. While hydroxychloroquine has not turned out to be an effective treatment, it has shown that approval of new treatments can proceed quickly when there is the political will to do so.
Wrapping up
Overall, then, we should prepare to see cumulative cases and cumulative deaths continue to rise for the rest of the year until we have either an effective treatment or vaccine. If we can maintain a steady rise rather than the exponential rise we saw in March and early April, our healthcare systems should be better able to handle it. There is reason to be optimistic about the potential for a vaccine, but any vaccine would be unlikely to be widely available before the end of the year. For this year, the better possibility is that a treatment will be found that makes use of already available methods and pharmaceuticals. We’ve already seen some false starts in this direction, hopefully we will eventually see one that fulfills its promise.
In the meantime, our best bet for keeping the numbers low is to continue social distancing as much as possible. It can be hard to keep up the effort, but it’s already had measurable effects and is the one thing most of us can do to contribute. Try to find a pattern that is comfortable and works for your situation. Accept that your pattern may be different than others’, we all have different circumstances, but focus on doing what you can while those who have the knowledge and expertise search for more permanent solutions.
In the short term
Over the next ten days, here’s what things may look like. We’re still headed to about 1.8 million cases and over 100,000 deaths by the end of May..
| Day | Cases | Deaths |
| 5/21 | 1,577,147 | 94,702 |
| 5/22 | 1,600,190 | 96,032 |
| 5/23 | 1,623,239 | 97,362 |
| 5/24 | 1,646,288 | 98,691 |
| 5/25 | 1,669,337 | 100,021 |
| 5/26 | 1,692,386 | 101,351 |
| 5/27 | 1,715,435 | 102,681 |
| 5/28 | 1,738,484 | 104,010 |
| 5/29 | 1,761,533 | 105,340 |
| 5/30 | 1,784,582 | 106,670 |
| 5/31 | 1,807,631 | 108,000 |