
As far as the numbers go, we’ve been waiting to see whether Sundays’ very low numbers represent a real improvement or just noise, and we’ve been waiting for the first signs of reopening to appear. We have some preliminary answers on both counts.
**Sunday’s Numbers**
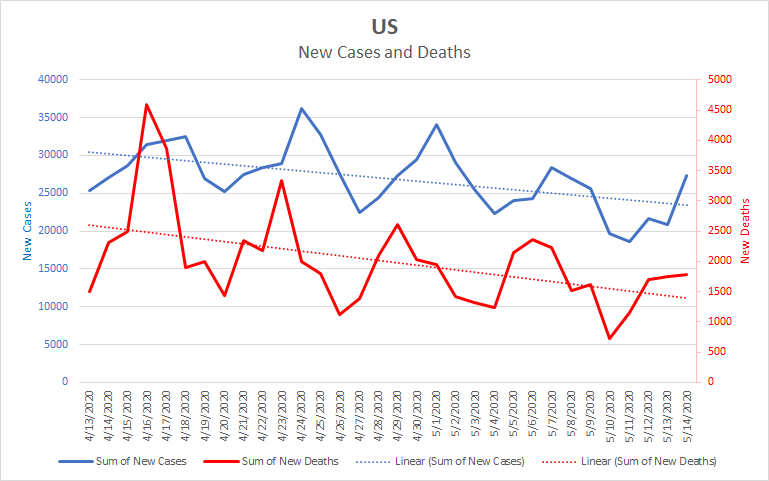
On Sunday, May 10, both the new case and new death numbers were remarkably low. While national numbers have been going down over the last month, Sunday’s decrease was noticeably larger than expected. Since Sunday, the numbers have risen back into the expected range. They’re still dropping overall, but at about the same rate they have been. We’ll need to wait for the weekly cycle to finish to be sure, but for now it looks like just some noise in the usual pattern we’ve been seeing. Here’s a graph.
**Signs of Reopening**
The graph above doesn’t show any substantial signs of increases due to reopening, but we really wouldn’t expect it to. With the delay between infection and symptoms, only a few states have been reopening long enough to potentially show an effect. Those increases would be drowned out in a national level graph. Let’s have a quick look at the state graphs for Georgia, Florida, and Texas.
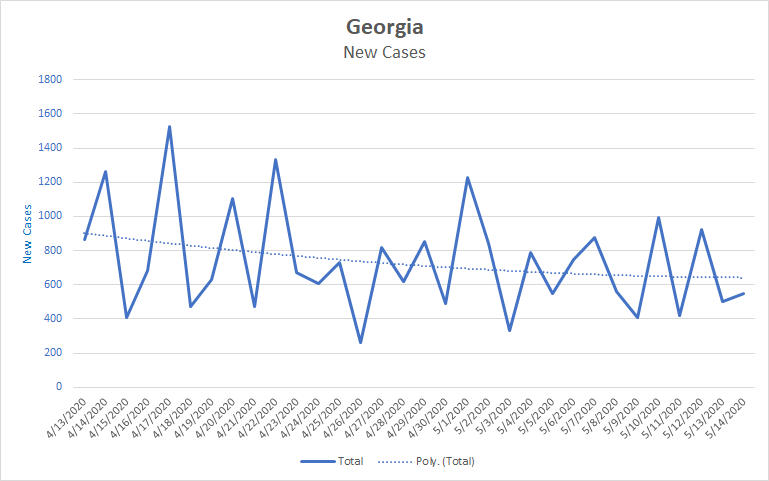
You’ll notice that the trendline for this graph is curved.a bit. I’ve used a different type of formula for it in order to give some idea of how it is changing over time. (2nd order polynomial if anyone cares.) You can see the trendline get flatter over time. This means that while cases are still decreasing, they are not decreasing as much as they were. So this is some grounds for thinking that Georgia is seeing some negative impact from reopening. We should have a clear view in another week.
Florida started reopening on May 4th, though it didn’t seem to be fully closed even before then. Here’s its graph.
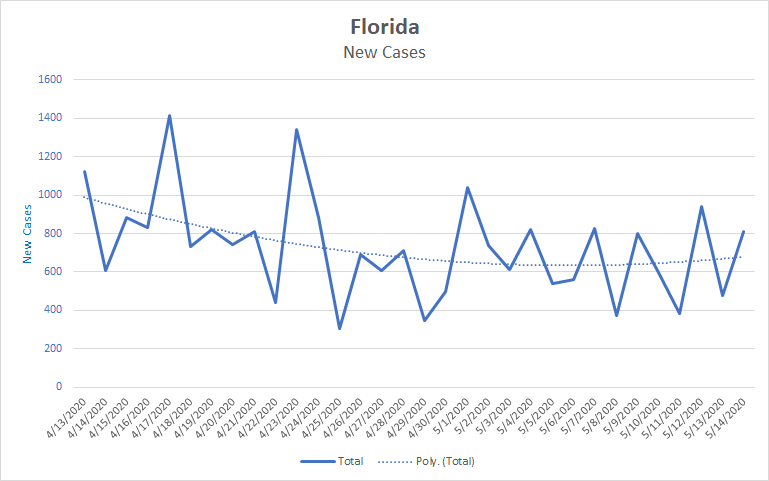
As you can see, the trend line shows going from a decrease in cases to increasing. To be fair, we should let these numbers go another week before drawing conclusions, the data has a fair bit of noise in it. However, at this point there is at least some reason to think that reopening is having an impact on the number of new cases.
Finally, here’s Texas. Texas started reopening on May 1st, but the move was announced several days earlier and not everyone waited. Unlike Georgia and Florida, Texas had increasing growth rates when it started reopening.
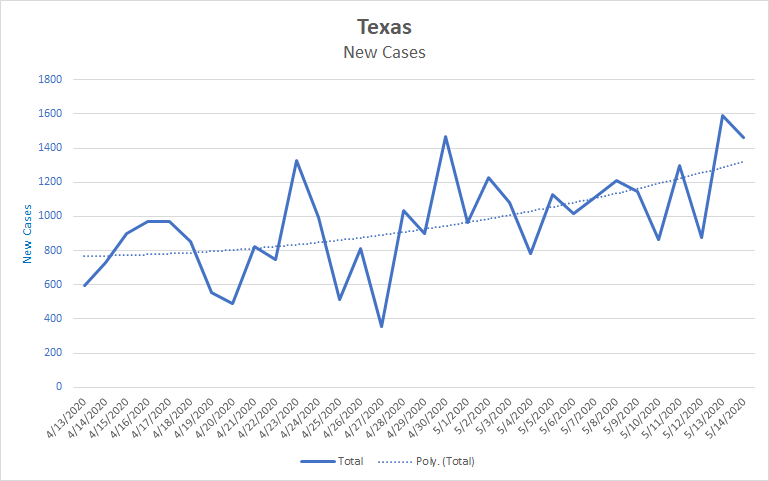
Again, we really should wait another week to be sure, but this graph looks very suggestive. There’s little doubt that Texas’ growth rate is increasing, but there is some question about the extent to which that is due to reopening rather than people just generally not following guidelines.
Just for the sake of comparison, here is the graph for Illinois, a hard hit state that extended its stay at home order with only minor relaxations and won’t begin significantly reopening for another couple of weeks.
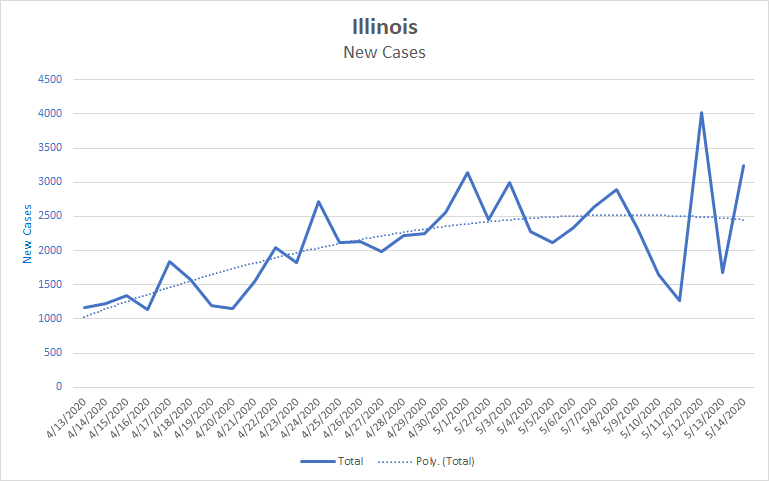
As you can see, they have a very different outcome despite having been harder hit. Their curve is decreasing in slope rather than increasing.
So, at least provisionally it seems that reopening is beginning to raise growth rates while remaining closed is continuing to decrease rates. Lest I be thought to be cherry-picking the data, if anyone wants to see the graph for a specific state, let me know in the comments and I’ll try to provide it.
**Things to watch for**
There’s some good news on the vaccine front, with a study that strongly suggests that it will be possible to develop an effective vaccine for the virus. Rather than reinventing the wheel, let me point you to Derek Lowe’s excellent discussion of it. https://blogs.sciencemag.org/pipeline/archives/2020/05/15/good-news-on-the-human-immune-response-to-the-coronavirus
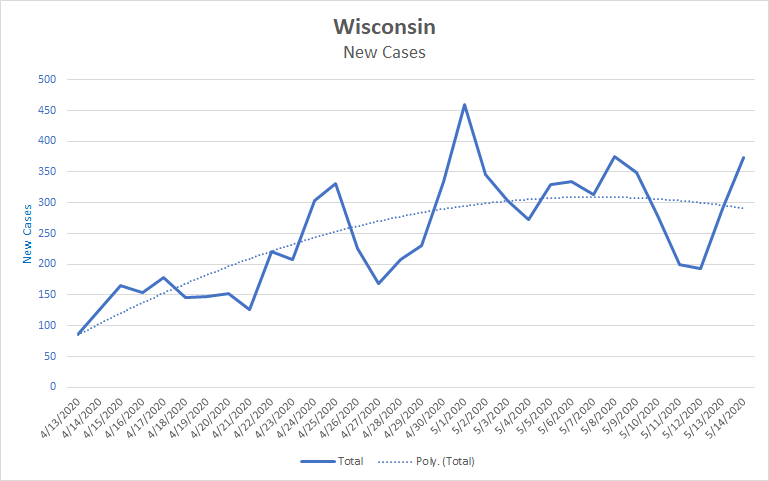
Wisconsin’s Supreme Court recently struck down the Governor’s stay at home orders. You may recall that this is the same court that insisted that in person elections take place despite having to close many polling places due to the pandemic. As a result, Wisconsin has gone rather suddenly from having strong stay at home orders to not having any at all. It will be instructive to watch what the effect of that is. Here’s their graph as of last night.
Projection
Here’s what the numbers may look like for the next 10 days. We’re still on track to be over 100,000 deaths by the end of the month and around 1.75 million cases.
| Day | Cases | Deaths |
| 5/14 | 1,417,774 | 85,898 |
| 5/15 | 1,443,505 | 87,515 |
| 5/16 | 1,469,249 | 89,133 |
| 5/17 | 1,494,993 | 90,750 |
| 5/18 | 1,520,736 | 92,368 |
| 5/19 | 1,546,480 | 93,985 |
| 5/20 | 1,572,224 | 95,603 |
| 5/21 | 1,597,968 | 97,220 |
| 5/22 | 1,623,712 | 98,838 |
| 5/23 | 1,649,455 | 100,455 |
| 5/24 | 1,675,199 | 102,073 |
Thanks for reading. Whatever state you’re in, the more you can reduce your own risk, the more you protect your family and those you come into contact with.