
I haven’t done a COVID update for a couple of weeks as I’ve been busy and the numbers have been unusually difficult to interpret. Both my schedule and the numbers have settled down, so here’s where we stand now. Let’s start with the national graph.
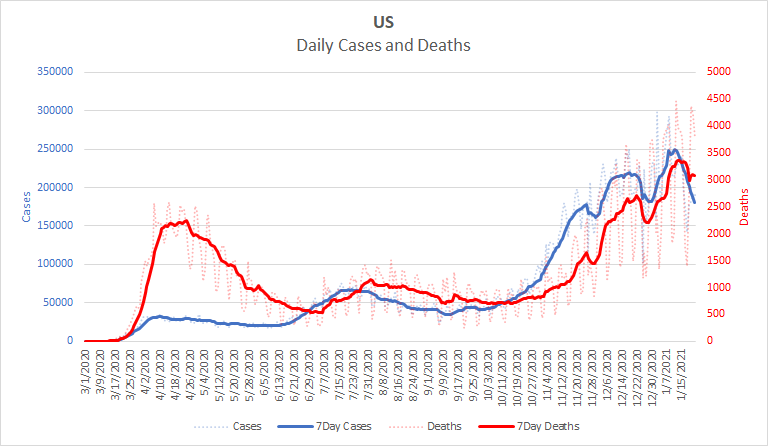
It’s important to note just how much the winter surge dwarfs the earlier surges. It is many times larger. At the right side of the graph you can see the cases and deaths drop off dramatically. Here is a zoomed in graph so that we can see that area better.
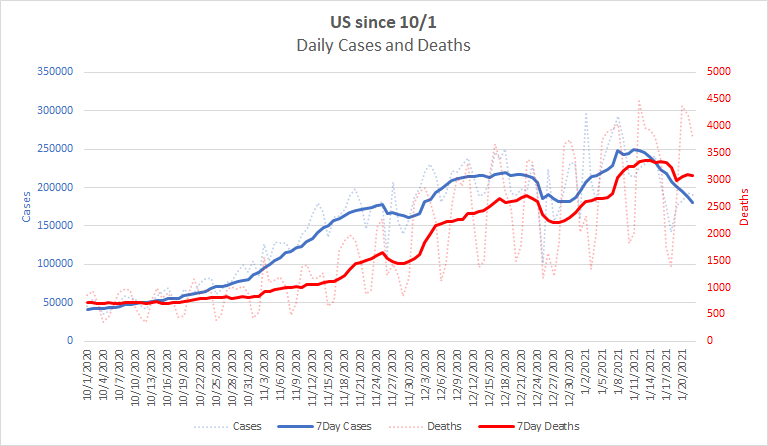
Here you can see that cases have been dropping steadily since January 11th. The pattern in deaths is less clear, but they are down from their peak and appear to have started dropping around a week later. However, there is a lot more volatility in the death numbers. The most prominent drop is due to very low reported numbers on the 17th and 18th, both well below 2000, but we have seen two days well over 4000 since then. This volatility, combined with the dips from the holidays are what has made the numbers difficult to interpret.
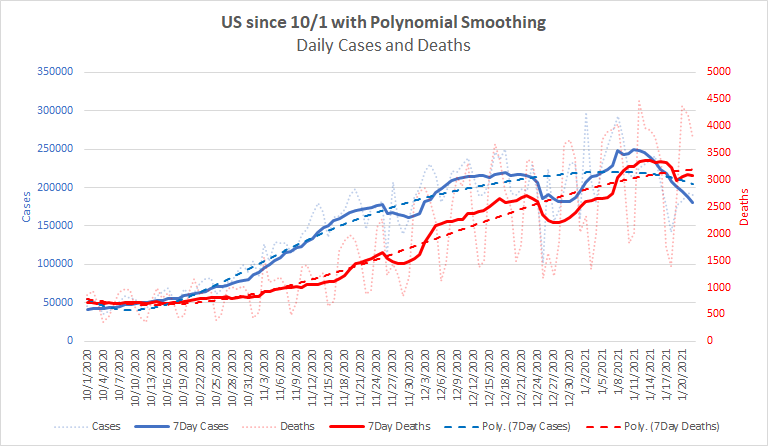
The numbers we see are just the reported numbers but what we’re really interested in are the actual numbers – how many people actually were infected or died. The reported numbers are different from the actual numbers for a variety of reasons, but one is because reported numbers follow the schedule of the people doing the reporting. This is why the reported numbers follow a weekly cycle. We use a 7 day moving average to smooth out the 7 day cycle and get a clearer estimate of the actual numbers. Holidays, however, cause disruptions outside of the 7 day cycle and so are not smoothed by them. The winter holiday season is large enough to really mess up the 7 day averages, so we would like to have a way of smoothing them out. There is no perfect way to do this. If these graphs were on paper, you might take a pen and sketch a curve that seemed to capture the general pattern of a line. But I might do the same thing and sketch a different curve. There is no single best way to do this kind of smoothing; it involves inferences from how epidemics generally behave and assumptions about how that behavior might be disrupted by the current circumstances. Here’s a graph with one way of drawing such lines. The smoothed lines are those with thick dashes. On this view, cases crested at about the beginning of the year and deaths are cresting about now.
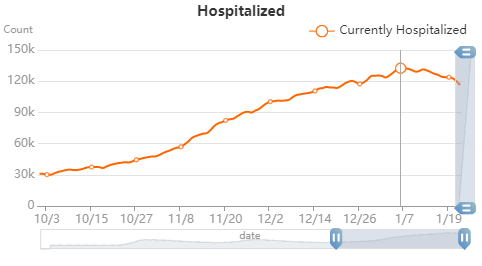
In support of this general view, here is the hospitalization graph from 1point3acres.com you can see that hospitalizations have been declining since the 6th. We would expect hospitalizations to lag infections a bit as it takes several days for an infection to become severe enough to require hospitalization.
To get an idea of how widespread the decline is, let’s look at a couple of maps. These are maps showing the number of cases per 100k population in each state on the 12th and the 22nd.
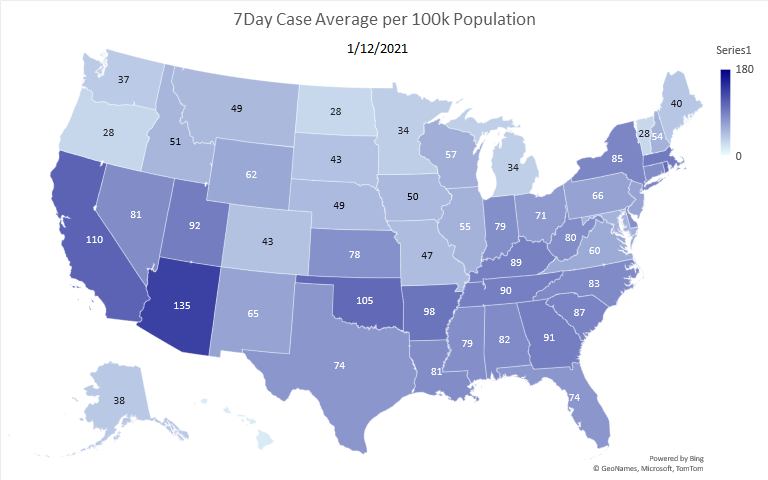
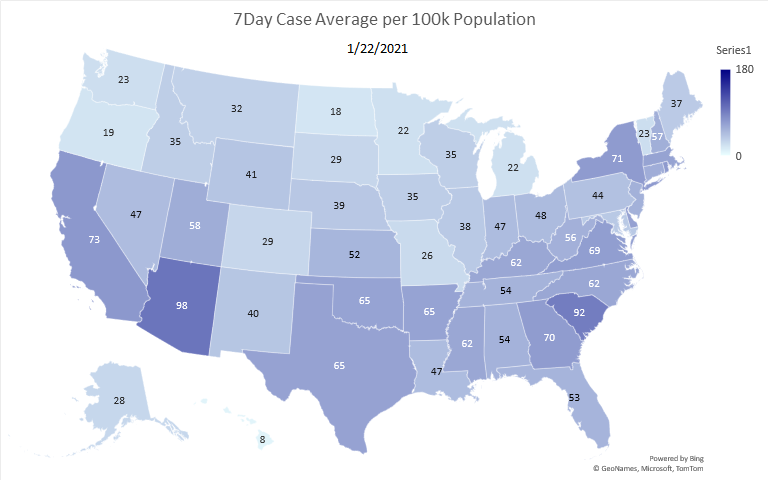
As you can see, the decline is quite widespread with only South Carolina showing increasing infections.
FInally, here is the county level heatmap for cases per population. Despite being in shades of red, this is cases not deaths. I’ve violated my usual color scheme as the differences weren’t as visible in blues. At this level of detail.
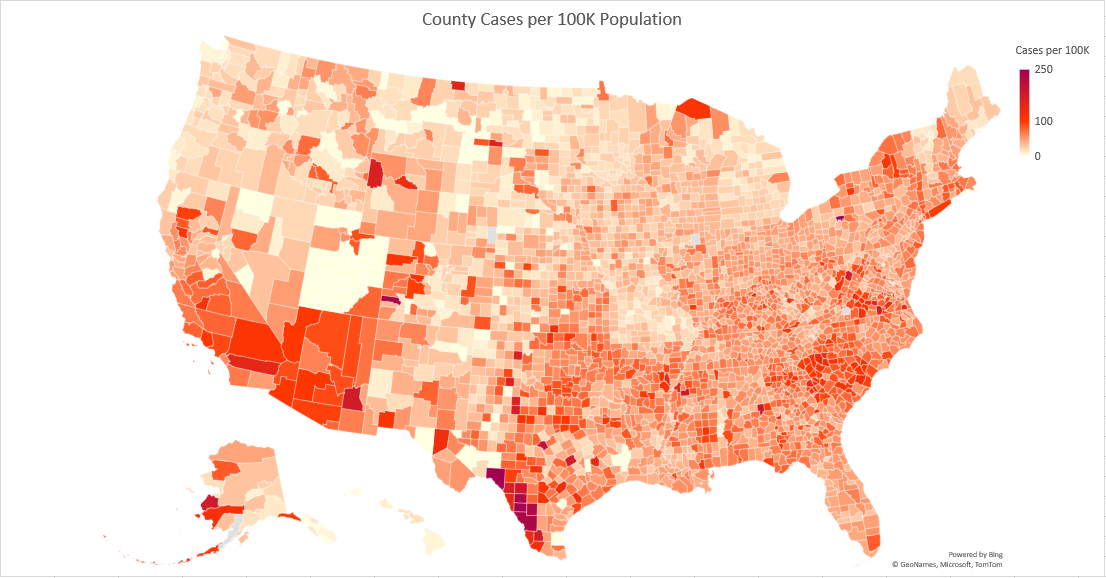
The southern border of Texas is the hardest hit area, but there are hotspots in California, Arizona and a few other states as well.
Despite the dangerously high numbers, we are at least heading in the right direction and have been for at least two to three weeks. However, there are more dangers around the corner, some are within our control, others aren’t.
Outside of our control are the new variants of the virus. We now have multiple new variants that are more infectious than the version we’ve been fighting. These variants are already present in the US. The UK variant, B.1.1.7, is sufficiently more infectious that case numbers have risen in the UK even during a lockdown. We’re beginning to see recommendations for double masking in order to help fight the spread of this variant. Double masking uses a higher quality mask, e.g. an N95, covered by a fabric mask. The goal is to reduce the amount of virus that gets through if one is exposed. These new variants seem to multiply in our bodies much more rapidly than previous variants, so the same initial amount of virus leads to a larger infection. The less virus that gets into your body initially, the better your body will be able to fight it off. So far, we don’t know whether the UK variant is deadlier than others. There is some indication it might be, but we don’t have enough data to be sure one way or another.
Inside our control is the effort we put into avoiding infections. If we all breathe a sigh of relief at the declining numbers and let down our guard, they will skyrocket again. This is what happened after the spring and summer surges. The numbers started going down, so people started being less careful, so the numbers went back up even higher. Really though, this is the time to be even more careful so that we can finally beat the virus. Imagine a sports team that stopped trying as hard whenever it was winning. It wouldn’t win much.
Our goal should be to keep the numbers declining while the vaccines roll out. Remember that it will take months to get enough vaccines administered to really make a difference. With each vaccine requiring 2 shots, we need a bare minimum of about 400 million injections before we can hope to have a significant degree of herd immunity. Each infection that occurs before then is another opportunity for the virus to mutate and become more infectious. More infectious variants require even higher levels of vaccination to provide herd immunity.
So, keep up the effort. Isolate as much as you can. Socially distance and mask up if you can’t isolate. Double mask for any extended exposure. If we all do this, then combined with the vaccines we can look forward to a return to more normal times after. If we don’t, then we’ll be looking at another surge that may make this one look small.
Be safe. Be Well.