
Yesterday, Nov. 4, saw 102,831 new cases and 1,097 deaths. This is the first time the Johns Hopkins tracker has shown over 100,000 cases in a single day. However, if the usual weekly pattern holds, we should see 6 digit cases for the next three days at the very least and possibly from here until we hit a crest. 31 states now have a 7-day case average of more than 1,000 cases per day. Here is the national chart.
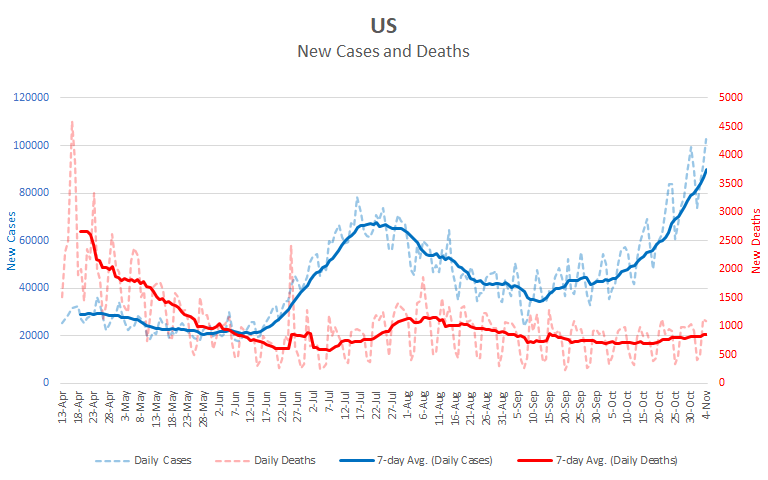
The scale of this chart makes some details difficult to see. I’m going to zoom it in to the period from Aug 1 until now so that we can see the current surge more clearly. Be aware that this will change the vertical scales, so you can’t visually compare the steepness of the lines between the two charts. Also, remember that the blue cases line uses the blue vertical scale on the left of the chart while the red death line uses the red vertical scale on the right of the chart. Here is the chart looking only since Aug 1.
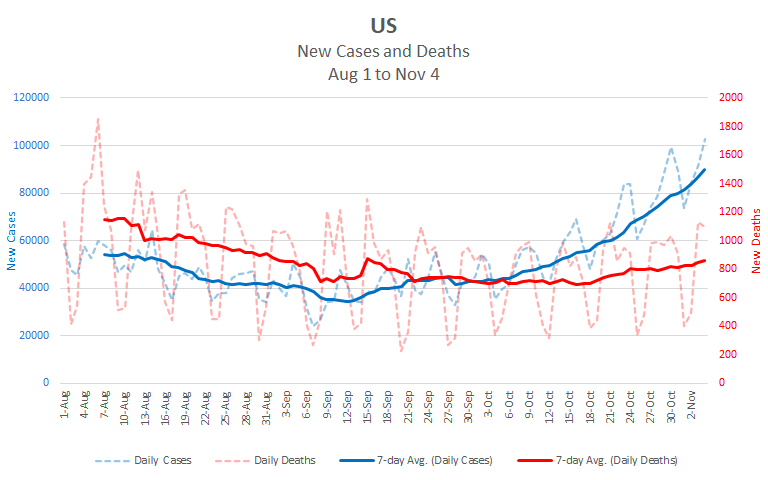
First, notice daily cases continue to rise and to accelerate. Over the past 10 days, the 7-day average of daily cases has risen by more than 20,000 cases per day. That means that on average, we are seeing 20,000 more cases each day that we were on the 25th of October. In the 10 days from October 10th to 15th, that number rose by only 15,000. Cases are not only rising, they are rising faster and faster as the surge continues. You can see this visually by notice that the blue line is getting steeper over time.
Second, daily deaths have been rising noticeably since about the middle of October. It’s less clear, however, whether they are accelerating. The line goes up, then levels a bit and then goes up again. My best read of the numbers is that they are starting to accelerate, but only time will tell for sure. Looking beyond the data in the graph, it is reasonable to expect deaths to follow as a percentage of cases. Deaths are lower now than they were in April because we have learned a lot about how to most effectively treat the virus. However, we haven’t made a lot of advances in that area over the last month, so we should expect deaths to rise as cases do, but on about a 2-3 week delay. Additionally, as cases rise, so do hospitalization rates. Hospitals in some regions are becoming stressed and that may lead to even higher death rates. Again, only time will tell. In general, expect daily deaths to continue to rise until a couple of weeks after we see a crest in cases.
Here’s an idea of what cumulative numbers may look like for the next 10 days. I’ve made some adjustments for acceleration in both cases and death. We should pass the 10 million case mark around the 10th.
| Day | Cases | Deaths |
| 11/4 | 9,485,296 | 233,714 |
| 11/5 | 9,579,200 | 234,579 |
| 11/6 | 9,678,824 | 235,447 |
| 11/7 | 9,781,420 | 236,318 |
| 11/8 | 9,887,059 | 237,216 |
| 11/9 | 9,995,817 | 238,117 |
| 11/10 | 10,107,770 | 239,022 |
| 11/11 | 10,222,998 | 239,954 |
| 11/12 | 10,341,585 | 240,890 |
| 11/13 | 10,463,616 | 241,830 |
| 11/14 | 10,589,179 | 242,797 |