
Two days ago, I said that it looked like cases were levelling off at pre-Labor Day levels. But this morning, the graph looks more dire. Let’s look at the graph first, and then I’ll explain what I think is going on.
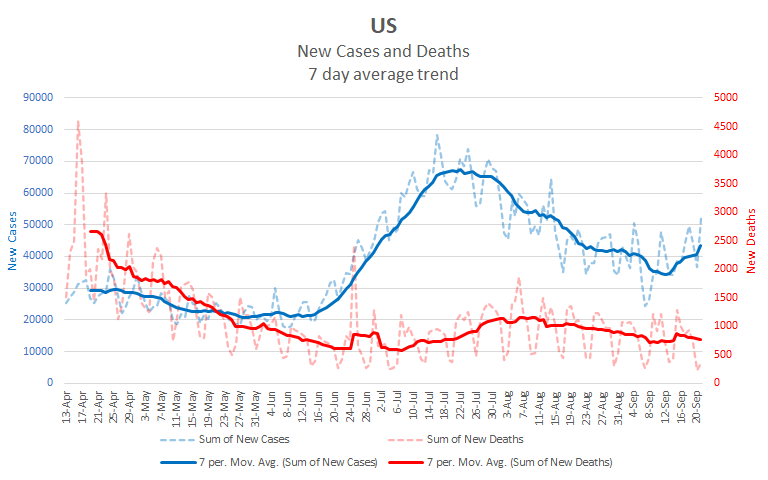
As you can see, the graph has continued to rise rather than levelling off. The 7-day average is currently at 43,319 cases per day, higher than it has been since Aug 22.
When I see something unexpected in the national numbers, I drop down to the state level and try to figure out what’s driving it. When I did so this morning, I found to things. First, states are generally doing worse than they were a week ago. I give states a quick rating as Rising, Steady, or Falling. If I can’t tell, I rate them as Unknown. This morning, 17 states were doing worse than they had been and only 5 had improved. In all, I rated 33 states as having rising numbers, including all of the 6 most populous states. This means that the situation is overall worse than it was, but it doesn’t really tell us why.
Looking at individual states also let’s us spot anomalies in the data, such as this one from Texas.
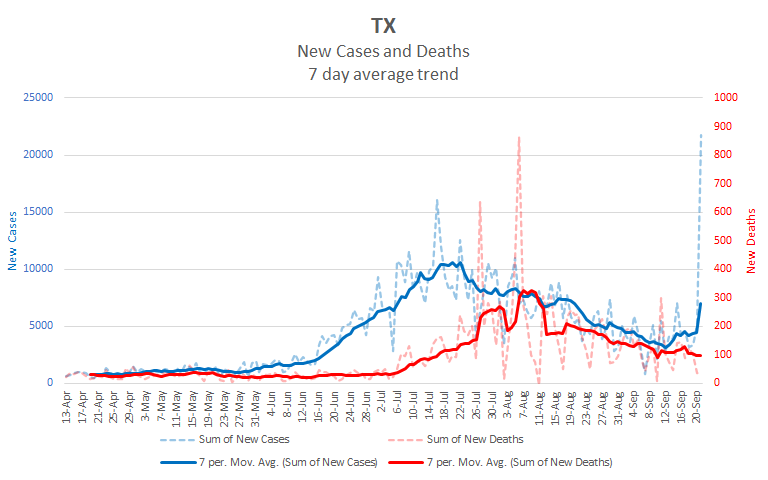
Yesterday, Texas reported almost 22 thousand cases in a single day. That’s over 5,000 more than its previous highest day and about 5 times higher than its 7 day average at the time. If we drill down to the county level, it turns out that most of that spike case from Harris County which reported nearly 14,000 cases. Here’s what we see on the county’s data page.

The important bit is in the note at the bottom, 13,534 cases were old cases that were only now reported due to backlogs and automation processes. So these are cases that were actually tested earlier but for whatever reason weren’t reported. If we remove these cases from yesterday’s numbers, it reduces the 7 day average for both the state and the nation considerably. Admittedly, the average would still be rising in both cases, but not nearly so steeply.
So, what to make of all this? On the one hand, it does appear that we’re still dealing with the effects of Labor Day. The question is whether the numbers would still be rising even if we accounted for the delayed cases. Mathematically, there are some things that could be done to figure this out if we had the right data, however, they would take more time than I have to devote to it and we don’t have the right data for a lot of areas. I’ll leave that heavy lifting to organizations that have more resources to devote to it. In the meantime, my gut reading of the data is that we may be seeing some rising even after accounting for data anomalies from Labor Day. Texas, for example, had been rising slowly for over a week before yesterday’s anomaly. This is probably due more to students returning to school than from Labor Day parties at this stage, but Labor Day parties and weather changes could soon accelerate the rise.
Overall, I’m still in a wait and see mode, but I’m more pessimistic than I was two days ago. Regardless of when these late data are actually from, they’re still many more cases than we thought we had, and that’s not good.