
There are a couple of interesting developments that relate to the numbers. I’ll discuss those and then move on to the projection.
Antibody Testing
First, we have more results from antibody testing, most notably from New York. New York tested about 3,000 people “at random” and concluded that nearly 14% of state residents had been infected and about 20% of New York City residents. That’s right at about ten times more infections than were known.
While I don’t find these results surprising, we don’t know a lot about the study. For example, we don’t know much about the test that was used. I haven’t found details on who made it, what the specificity and sensitivity were, etc. We also don’t know much about the testing procedure. News reports say that people were selected at random, but they also say that testing stations were set up at shopping locations and participants were selected from people who were there. These are not compatible claims. Selecting from people at a shopping location means that you will get more people who shop a lot, and fewer people who are being cautious. A person who goes shopping every day will have a higher chance of being near such a station while it’s open than will a person who only shops once a week.
There are many more things we don’t know about the study that could affect its findings. So at this point, I would take it simply as a data point and not put a huge amount of confidence in the precise numbers. As we get more details, and as more studies come out, we’ll have a better idea.
It’s worth noting that the results of this study aren’t as extreme as the results of the study from Santa Clara county that I mentioned a few days ago. Even though the Santa Clara study found only 2-4% infection rates, that was 50 to 80 times higher than reported cases in that county. The New York result of 14% is only about 10 times the reported cases. The infection fatality rate proposed by the Santa Clara study simply isn’t plausible for New York and there is little reason that the infection fatality rate in New York should be that much higher than in Santa Clara.
With that said, we don’t know. My working impression has been that actual infections are about 10 times the reported infections and that actual deaths are 2-3 times the reported deaths. I want to be clear that those are just my hunches and I haven’t done any math or research to put them on solid ground, it’s just how things seem to me.
Georgia
Georgia is among the very first states to start reopening and seems intent on doing it in the most bizarre way. The first wave of openings include “gyms, fitness centers, bowling alleys, body art studios, barbers, cosmetologists, hair designers, nail care artists, estheticians, their respective schools, and massage therapists”. It’s worth noting that most of these require physical contact with customers. Beyond that, gyms, fitness centers, and bowling alleys, all require some level of physical exertion, which will increase the distribution of any virus that may be being shed. On Monday, “theaters, private social clubs, and restaurant dine-in services” will open. Here again, these are high risk environments. Governor Kemp has said that businesses will be required to meet social distancing and hygiene requirements, but it’s pretty clear that just won’t be possible in many cases. The internet is abuzz with speculation about why these particular moves are being taken, especially when daily case numbers are still on the rise in Georgia. However, I want to make some point about the numbers we’re likely to see.
The main thing to remember is that infections take a while to show up. On average, it takes about 5 days to go from infection to symptoms. So the very earliest we could see any effect in the numbers would be next Wednesday. However, given that it takes longer for symptoms to build, and that businesses won’t all open on the first day possible, I wouldn’t expect to see a lot of change in the numbers until about 2 weeks out. The problem is that while the numbers have been rising overall, they’ve been up and down on a day to day basis. Here’s a graph. The blue line is the daily new cases. (Ignore the point after the dotted lines, that’s the count so far for today..)
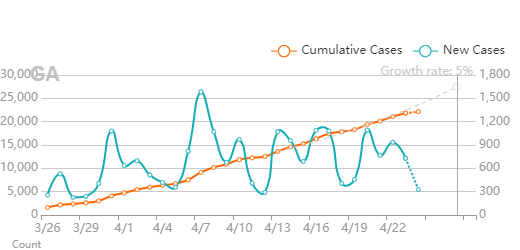
This kind of meandering line has a lot of “noise” in it. Even though it’s trending up, it’s not doing so consistently enough to make a change obvious. This will make it take longer to detect changes in the trend that may happen as a result of opening up these businesses. Further, while there is still an upward trend, that trend has been slowing. Because any effect of reopening will be delayed, we should expect this slowing to continue in the short term. This sets up a situation in which people can, and will, read their own preconceptions into the data. If the trend changes over the next week, that will be read as due to the reopening, even though it won’t have anything to do with it.
So Georgia is creating a kind of perfect storm of how not to reopen. It’s starting with high risk businesses, staging phases of the reopening before data can be acquired about earlier phases, and doing so against a backdrop of data that will make sober evaluation of the effects very difficult.
My best advice is to ignore anything you hear about Georgia’s numbers for the next two weeks unless you’re prepared to do some background research and validation. I have no doubt that there will be articles showing what a great success it’s been and others showing what a terrible failure it is, but most of them will mean nothing. In two weeks, we can revisit the numbers and see how they look. If there’s something notable in the data stream before then, look to impartial analysts to bring it forward.
Projection
My projection from 4/22 seems to have worked fairly well. We came out with about 8,000 more cases but about 200 fewer deaths than projected as of last night. The number of reported cases was up over the last two days, with more than 34,000 yesterday, but it’s too early to tell if that’s a change in the trend or just normal variation. It’s worth keeping an eye on as it’s been about a week since we’ve seen numbers as high as Wednesday’s and nearly two weeks since they’ve been as high as Thursday’s. Today’s projection will be based on gaining just over 29,000 cases per day and just under 5% per day growth in cases.
| Cases | Deaths | |
| Yesterday | 891,425 | 50,320 |
| 4/24 | 920,448 | 52,806 |
| 4/25 | 949,471 | 55,414 |
| 4/26 | 978,494 | 58,152 |
| 4/27 | 1,007,517 | 61,025 |
| 4/28 | 1,036,540 | 64,039 |
| 4/29 | 1,065,563 | 67,203 |
| 4/30 | 1,094,586 | 70,523 |
| 5/1 | 1,123,609 | 74,006 |
| 5/2 | 1,152,632 | 77,662 |
| 5/3 | 1,181,655 | 81,499 |
Be prepared to see numbers over a million early next week.
In the meantime, stay safe and healthy. The numbers will keep progressing whether we pay attention to them or not. There is, however, much that we can do to improve the quality of our lives and the safety of our families. Stay focused on the things that add concrete value to your life. I happen to enjoy data and numbers, but even I take time to walk in the woods.