
I’m starting with two questions today: Are cases still growing exponentially and to what extent is the current growth in cases due to the amount of testing rather than to the actual infection rate? The first of these questions is relatively straightforward, so I’ll start with it and do a projection. Then I’ll offer some thoughts on the second.
One of the easiest ways to check this is just to see how our linear projection from last Friday is doing. Here’s what we projected for the last three days based on adding 32,000 cases per day along with the actual numbers.
| Projected | Actual | |
| 10-Apr | 502,570 | 504,272 |
| 11-Apr | 534,570 | 534,410 |
| 12-Apr | 566,570 | 562,030 |
Those numbers are pretty close.We can quibble about how they might hold up for the long term, but over the short term they seem to work pretty well. My exponential projection had us at
592,783 for the 12th, so the linear projection did much better. The average number of new cases over the last 5 days was 31,911, which is pretty close to 32,000. So here are the numbers based on a linear increase in cases of 32,000 per day and a rate of 13% per day growth in reported deaths.
| Cases | Deaths | |
| Current | 562030 | 22150 |
| 4/13 | 594030 | 25030 |
| 4/14 | 626030 | 28283 |
| 4/15 | 658030 | 31960 |
| 4/16 | 690030 | 36115 |
| 4/17 | 722030 | 40810 |
| 4/18 | 754030 | 46115 |
| 4/19 | 786030 | 52110 |
| 4/20 | 818030 | 58885 |
| 4/21 | 850030 | 66540 |
| 4/22 | 882030 | 75190 |
Having made this projection, it’s important to understand its limitations. Beyond my usual caveats, we seem to be at something of an inflection point. We’ve seen our growth rate slow to a point where we seem to be adding the same number of cases per day. If this overall trend continue, we may be close to seeing the number of new cases each day decrease, much as we have seen in Italy. This would be great news. At the same time, as people feel increasingly optimistic, we’re likely to see a decrease in social distancing practices. People see the numbers getting better and tend to think that means we’re through the worst of it and can relax. But this is sort of like dieting, losing some weight and thinking that means you can stop dieting and still keep losing weight. There’s a real danger that as social distancing is relaxed that we’ll see numbers rise quickly again. So, we’re at a point where the numbers could change in either direction over the next couple of weeks.
This type of inflection point is easier to see by looking at the number of new cases per day rather than at the cumulative number of cases. For example, here are two charts showing the growth in cases over the same period. The first shows cumulative cases:
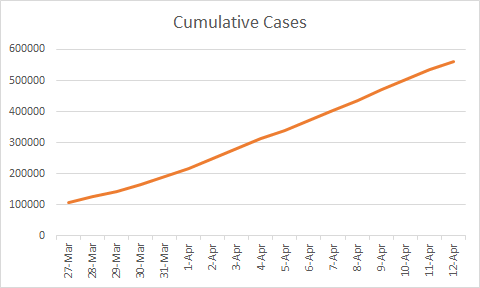
It mostly looks like a fairly straight line. It’s hard to see much improvement in recent days here. Compare that to the same period graphed on new cases per day. I’ve used a 5 day rolling average to smooth out the data a bit.

The change is much more obvious in this graph. Since about the 4th of April, the growth in new cases per day has been close to flat.
Here’s one more graph. This one shows the 5 day rolling average for new cases and for new deaths. The cases are the orange line, the deaths are gray. One important thing to note about this graph is that the two lines are measured differently. The values for cases are on the left edge of the graph, the values for deaths are on the right. If you didn’t notice this, you might think that almost everyone who gets infected dies as a result, but that isn’t true.
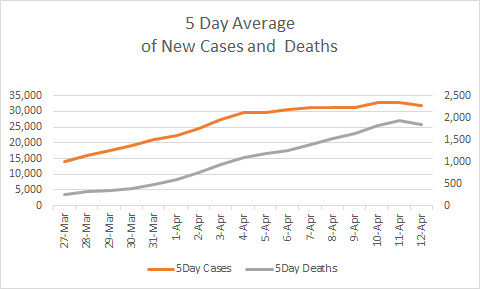
Notice the tantalizing dip at the right end of both lines. It’s very tempting to read that as a sign that both new cases and new deaths are starting to drop. I would resist that temptation. Here is a graph of the actual daily numbers rather than 5 day averages that shows why.

The last day of the graph is April 12th, a Sunday. The prior Sunday was April 5th, the one before that was March 29th. Notice that all of the Sundays on the graph have a noticeable dip. It’s likely that this pattern has more to do with social customs than with people actually getting the disease less or dying less on Sundays. More likely it’s that less recording and testing is done on weekends than on weekdays. So don’t be surprised if the numbers jump up tonight.
Speaking of tonight, it’s taken me much longer to get this posted today than it usually does. I started off with two questions, but I’m going to go ahead and post this now and come back to my second question tomorrow.
Be safe, remember to keep up with social distancing even as the numbers improve.
Thanks for reading.